Java Runtime Monitoring
On this page
Intro
When running busy systems at scale it is common to experience infrastructure problems, perhaps due to unreliable networks or slow database connections. These issues may then result in increased CPU or memory usage, or delays due to waiting threads, so it is recommended to ensure that good troubleshooting capabilities are available. With the Curity Identity Server there are a number of levels of troubleshooting tool:
| Tool | Description |
|---|---|
| Alerts | The Alarms Subsystem provides early warnings if external connections are failing |
| Dashboards | Operational staff can use a Dashboard to visualize the state of the running system |
| Logs | The Curity Identity Server provides various type of Logs for troubleshooting purposes |
| Metrics | Prometheus compliant metrics are available for purposes such as Autoscaling during high load |
| Java Monitoring | Java tools can be used to capture and analyze lower level Java Virtual Machine (JVM) profiling data |
This tutorial will show how to get set up with Java monitoring and profiling tools, for cases when you have difficult support cases that cannot easily be resolved by the first three options. This will enable you to capture a trace and analyze it yourself, or to supply this data to Curity technical staff as part of a support ticket.
Java Monitoring Components
All instances of the Curity Identity Server execute within a Java Virtual Machine (JVM) that uses the Azul Zulu Java runtime. This is based on OpenJDK, with enhanced monitoring and profiling capabilities that were originally provided by Oracle. The following tools enable you to capture and analyze JVM related metrics:
| Tool | Usage |
|---|---|
| Flight Recorder | Captures JVM, system and Java level data related to CPU, memory, threads, timings and exceptions and writes this information to file |
| Mission Control | A user interface which loads the raw file data and presents it in a visual way, allowing you to drill into common problem areas |
The overhead of using flight recorder is minimal, since it uses data from other core Java runtime components, such as the garbage collector. It can therefore safely be activated in production environments when you need to troubleshoot. We recommend becoming familiar with the recording technology so that you have the best future options for dealing with potential problems.
Running Monitoring Components
An easy way to understand how to run these components is via a Docker environment on your local computer, so that you are using a JVM that is dedicated to the Curity Identity Server. The following command can be used, which sets ENABLE_JMX and JAVA_OPTS environment variables, and also exposes the Java Management Extensions (JMX) port to the host computer:
docker run -it \-e ENABLE_JMX=1 \-e JAVA_OPTS="-Dcom.sun.management.jmxremote.ssl=false \-Dcom.sun.management.jmxremote.authenticate=false \-Dcom.sun.management.jmxremote.port=7091 \-Dcom.sun.management.jmxremote.rmi.port=7091 \-Djava.rmi.server.hostname=localhost \-Dcom.sun.management.jmxremote.local.only=false" \-e PASSWORD=Password1 \-p 6749:6749 \-p 7091:7091 \-p 8443:8443 \curity.azurecr.io/curity/idsvr:latest
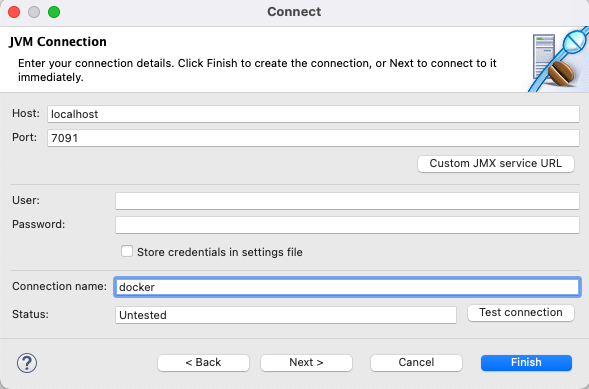
Then download and unzip Mission Control Application from the Azul website and run the program. Select File / Connect / Create a New Connection and connect to the Docker container via the port just exposed:
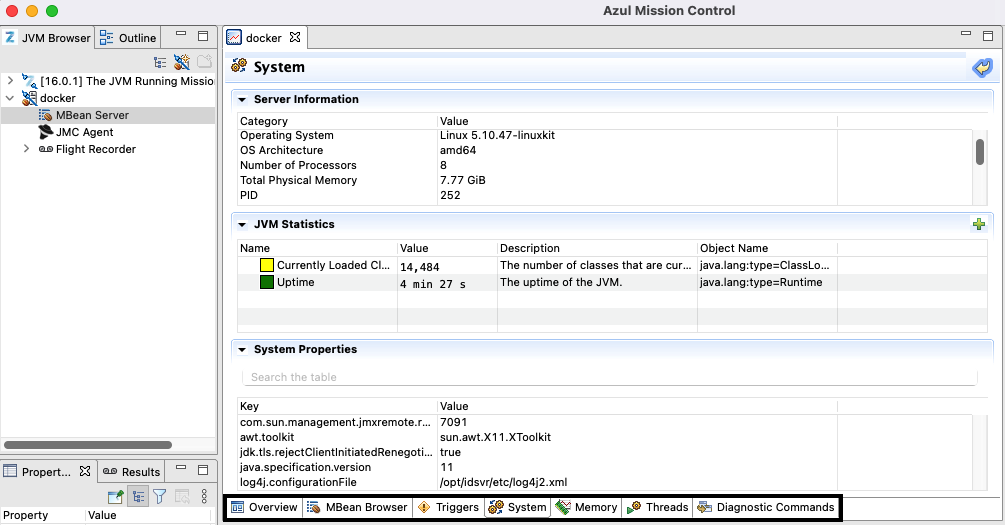
Double clicking the MBean Server icon then shows a number of options for viewing the runtime state of the JVM being connected to. The bottom menu options allow you to explore the live system and also to control Flight Recorder behavior:
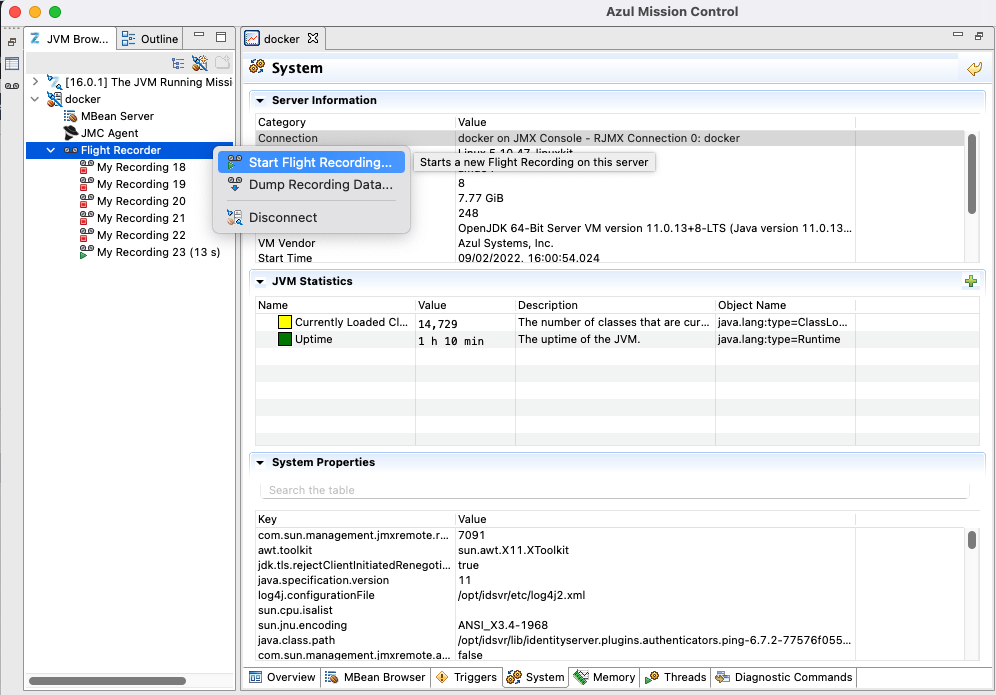
Typically though you will want to analyze the system at a specific time duration, and this can be done by selecting a flight recording manually, which will collect detailed metrics for that time period and then output binary results to a JFR file:
Results are then available for analysis, and although the information captured is low level, the Mission Control user interface can make sense of it and quickly point to areas of the system or code that are experiencing problems.
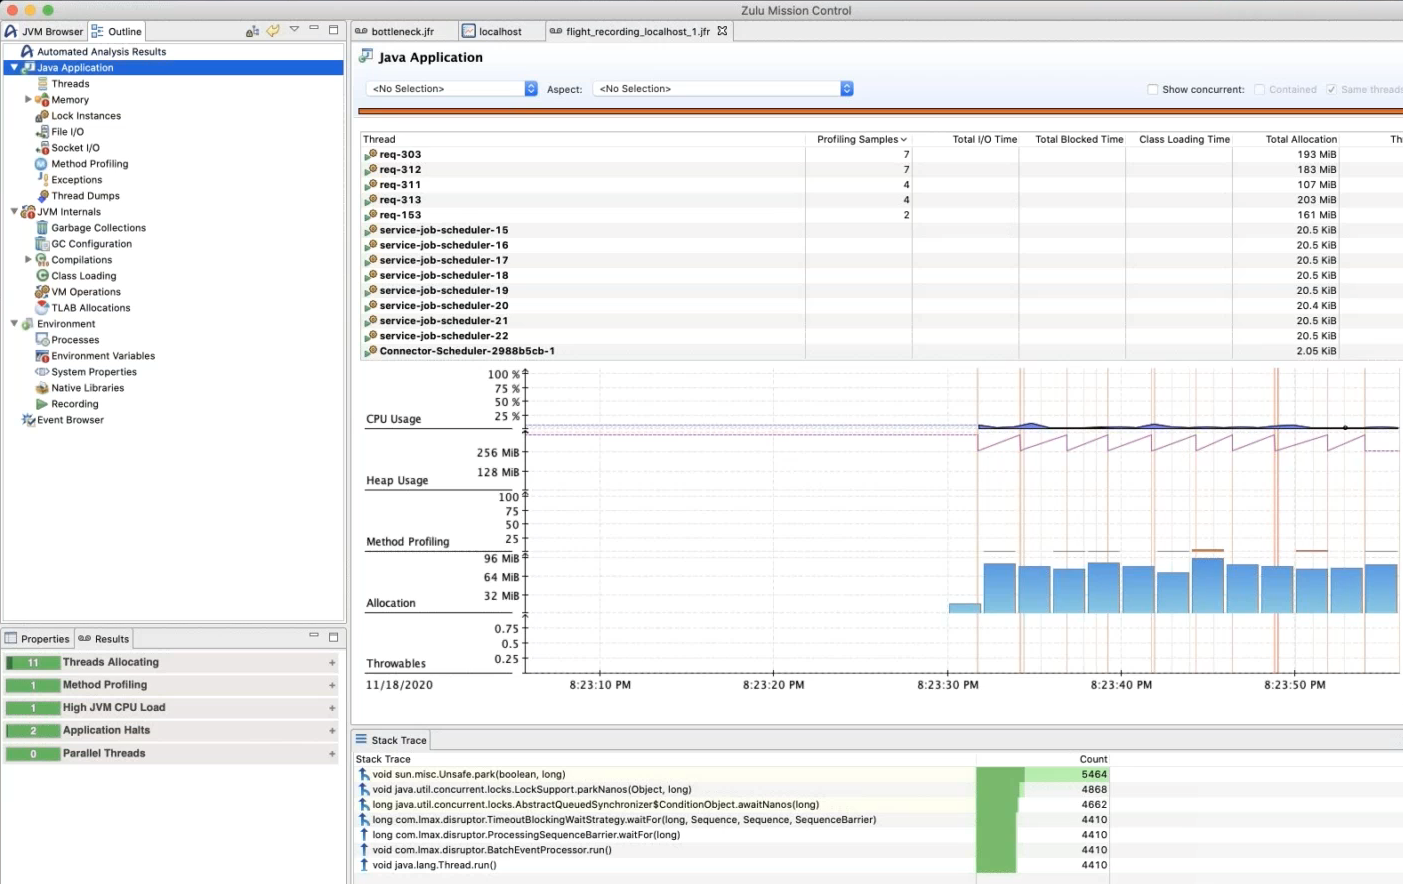
Analysis Views
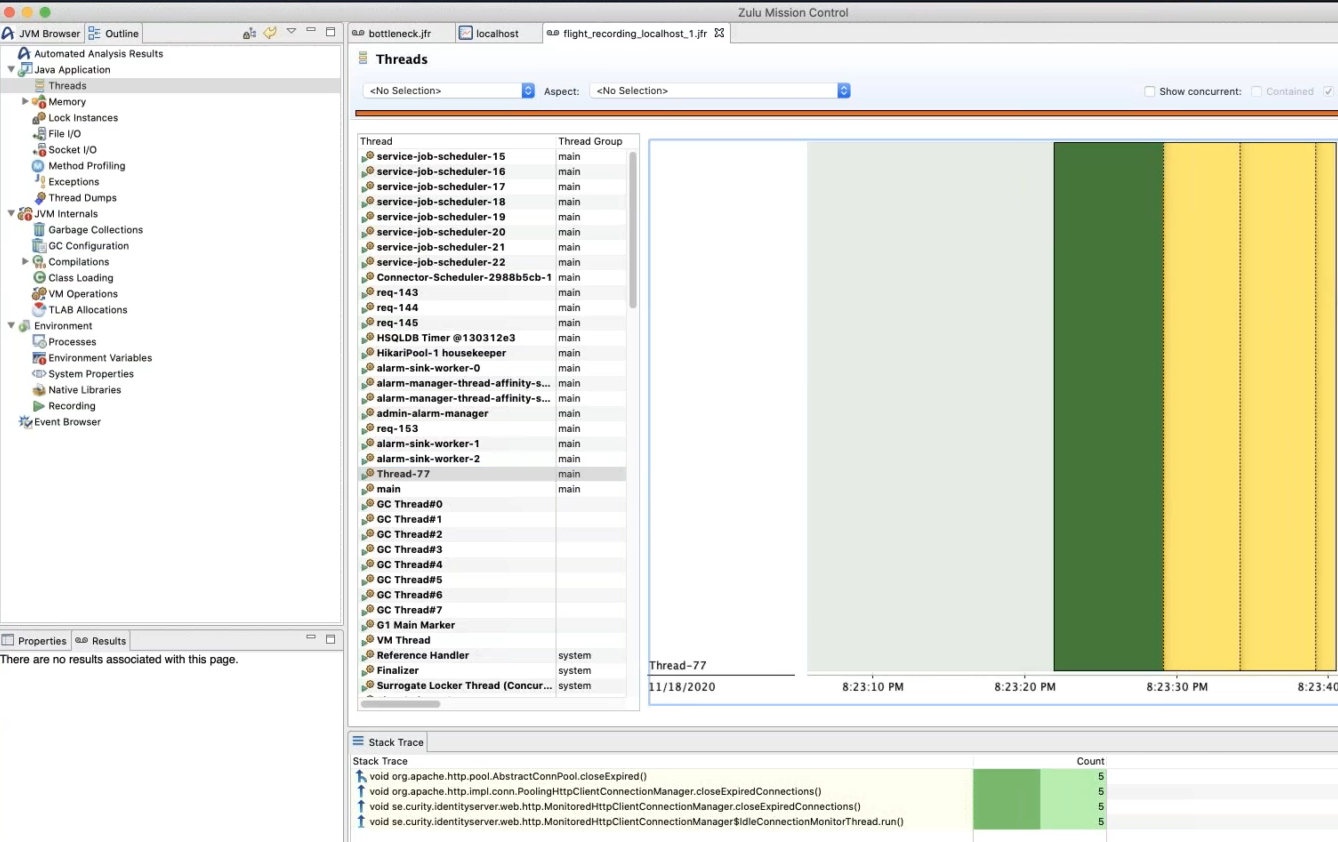
Once a capture has finished, the JFR file can be opened, and the state of the JVM can be analyzed. One of the first things to inspect is the state of running threads. Waiting threads are colored yellow, and if there are many of these it is a sign that some types of outgoing connection are blocked, in which case the call stacks for these threads will provide clues as to the cause:
Memory views work similarly, and can be useful to inspect if there are out of memory problems or leaks in Curity Identity Server plugins. Again the stack traces will point to the areas of code using most memory.
Many other views are also available, including other potential problem areas such as locks and exceptions, and these all contain useful call stack information to describe running code locations. This Azure webinar and demo provides a video walkthrough that explains the Mission Control functionality in more depth.
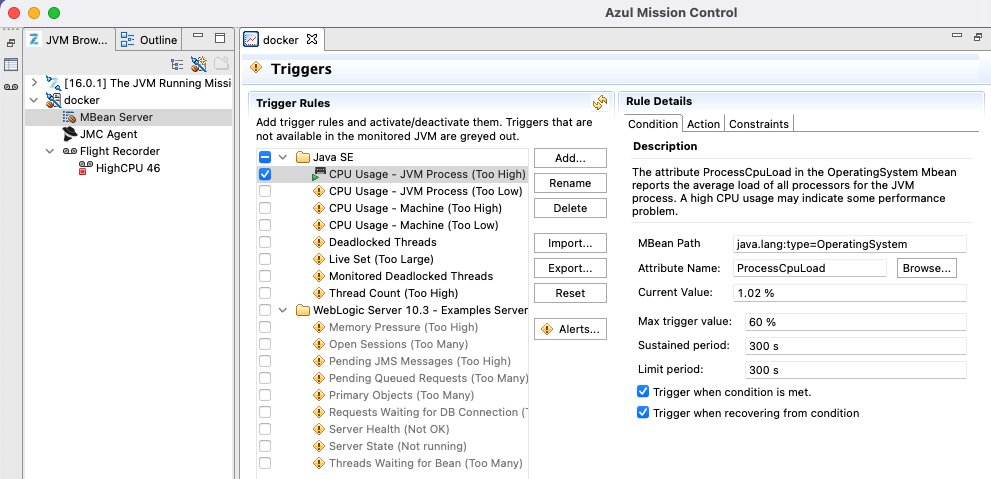
Conditional Capturing via Triggers
When you have an active connection via Mission Control, triggers can be used, to ensure that you capture data at a time when the system is in an unhealthy state. The following example indicates to take an action when the average CPU usage exceeds 60% for a period of 5 minutes:
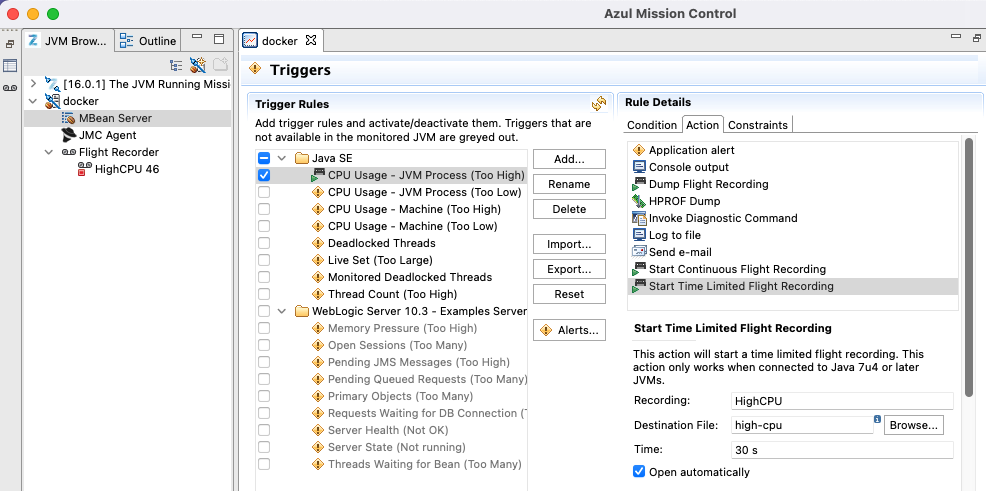
Various actions can be specified and in this example a flight recording is started, producing a JFR file when the system was unhealthy. This ensures that useful data is available for analysis after the event:
Capturing Data Only
Flight Recorder and Mission Control are typically run when you know you have a serious problem, such as the entire JVM crashing. Also you may be dealing with production environments where it is against IT policy to expose the JMX port. In this type of setup you can use reduced JAVA_OPT parameters, as in the following command, which captures data when the JVM is next terminated, or if the instance is stopped manually:
docker run -it \-e ENABLE_JMX=1 \-e JAVA_OPTS="-XX:StartFlightRecording=dumponexit=true,filename=/var/recordings/mycrashrecording.jfr" \-e PASSWORD=Password1 \-p 6749:6749 \-p 8443:8443 \-v ~/Desktop/recordings:/var/recordings \curity.azurecr.io/curity/idsvr:latest
This will again make a recording available on the specified volume, after which the data can then be analyzed offline in Mission Control, without needing to make a connection to the server. Alternative options for capturing data are also possible, including running the jcmd command line tool on a live instance without restarting it. Further information on how to use jcmd is provided in the Operation and Monitoring page of the System and Operation Guide.
Conclusion
The Curity Identity Server is hosted on a Java runtime with mature support for JVM profiling, enabling difficult support cases to be investigated. This tutorial showed how to use the Flight Recorder and Mission Control tools to diagnose any lower level JVM problems, if ever needed, and also to enable you to quickly supply useful data to Curity technical support.
Customer Stories
Learn how organizations run identity and API security at scale.
Read customer storiesWas this helpful?