Logging Best Practices
On this page
The Curity Identity Server writes a number of different types of logs. This tutorial summarizes some architectural behaviors and best practices to use logs effectively. Many organizations already use similar techniques for their APIs.
Use Customizable Logs
Logs for the Curity Identity Server use the extensible log4j2 framework. There are multiple loggers, each of which represents a type of data. Each logger outputs log events. You control the output location(s) with appenders and each appender's output format with layouts.
The System and Operation Guide explains the data that the Curity Identity Server writes to logs. Logging events use the following base fields.
| Field | Description |
|---|---|
| date | The UTC date and time of the log message. |
| level | The log level, usually INFO, WARN or ERROR. |
| request ID | A value that correlates to the request log. |
| session ID | A value that correlates to the user's authenticated session. |
| thread ID | The thread of execution for the request. |
| logger name | The logger name, which usually represents a Java class. |
| message | The log details as a string or key value pairs. |
The message property often contains additional useful data as key value pairs. For example, Request Logs add HTTP fields to the message property and Audit Logs add security event fields to the message property.
Deployments use a default logging configuration file at IDSVR_HOME/etc/log4j2.xml, which you can customize. The Debug Logging and Per-client Debug Logging tutorials explain some customization techniques.
Since log4j2 is an extensible framework it can use various extensions. For example, use Curity lnav Extensions to view logs in color with the Logfile Navigator. The following example command then renders multi-colored logs.
$IDSVR_HOME/bin/idsvr | tee -i $IDSVR_HOME/var/log/request.log | lnav
Use Secure Logs
In production systems, set the log level for the se.curity, the io.curity and the root loggers to INFO, which ensures secure logs and also good log performance:
<AsyncRoot level="INFO"><AppenderRef ref="rewritten-stdout"/><AppenderRef ref="request-log"/><AppenderRef ref="metrics"/></AsyncRoot>
The Curity Identity Server masks sensitive data to avoid recording personally identifiable information (PII), such as user names, emails or passwords.
Use Technical Support Logs
Use the system and request logs for technical support purposes. Often, roles like DevOps or engineers need access to technical support logs. The server generates system logging events due to events like system startup or to log errors or warnings during OAuth requests.
If an OAuth request generates a system logging event, the event data can include extra error fields. For example, a JDBC connection failure during an OAuth request could generate multiple log events. Some log events may include details like an error code in the message field and others may include an exception stack trace in the thrown field.
Error Log Events
Some logged error events are a normal part of OAuth flows. For example, the server may issue a challenge or return an expired response with an HTTP status code such as 401. Therefore, avoid raising people alerts based solely on the presence of an error logging event.
Use Audit Logs
Use Audit Logs to record information such as failed or successful logins and tokens issued. The logged fields vary depending on the type of security event. Often, security and compliance teams need access to audit logs. Audit logs save to log files and can optionally also be saved to a database using a JDBC appender.
Use OpenTelemetry
Activate OpenTelemetry to understand complex API requests and include spans from the Curity Identity Server. When a logger writes a logging event as the result of an OAuth request, the output can include OpenTelemetry TraceId and SpanId fields. See the OpenTelemetry Tracing for further information on correlating logs with traces.
Use Log Aggregation
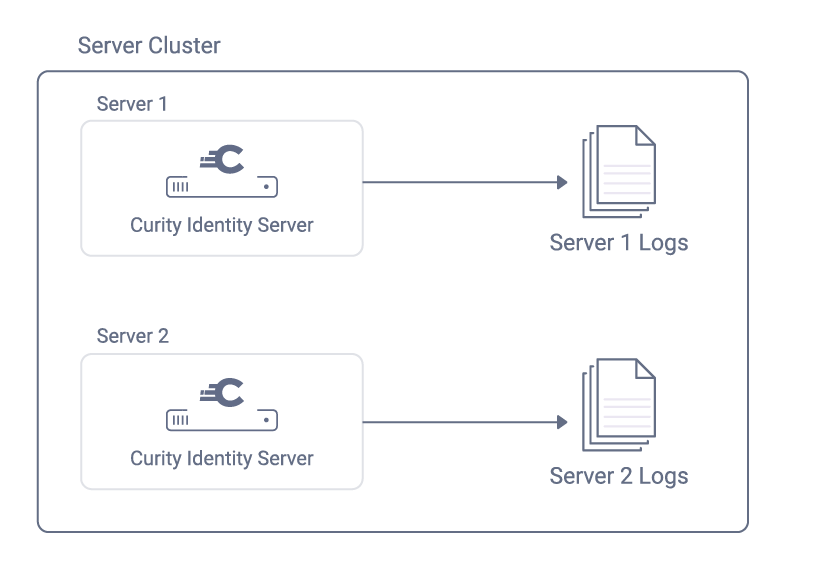
A default installation of the Curity Identity Server stores log files locally on each running instance. The system log is written to standard output (i.e. "stdout"), which cloud platforms typically capture as a file.

In a real world system there may be thousands of logging events output per day, so that locating particular logging events is a challenge. If logging is left in the default state, then the following behaviors are sub-optimal:
- Only IT administrators can access logs, so collecting the right logs can take time.
- Logs are difficult to analyze when the system is under load and data is in a raw file format.
- Investigating technical issues can take longer due to time consuming and error prone manual actions.
To improve the time to analyze, do some work to implement log aggregation, which requires the following types of third-party components:
| Component | Role |
|---|---|
| Log Shipper | A tool that reads incremental updates to log files on disk and sends them to a log aggregation API. |
| Log Aggregation API | An API that receives log data and provides an engine to serve queries. |
| Log Data Store | A data store that manages a large amount of log data. |
| Log Analysis Frontend | A frontend where authorized users filter log data in various ways. |
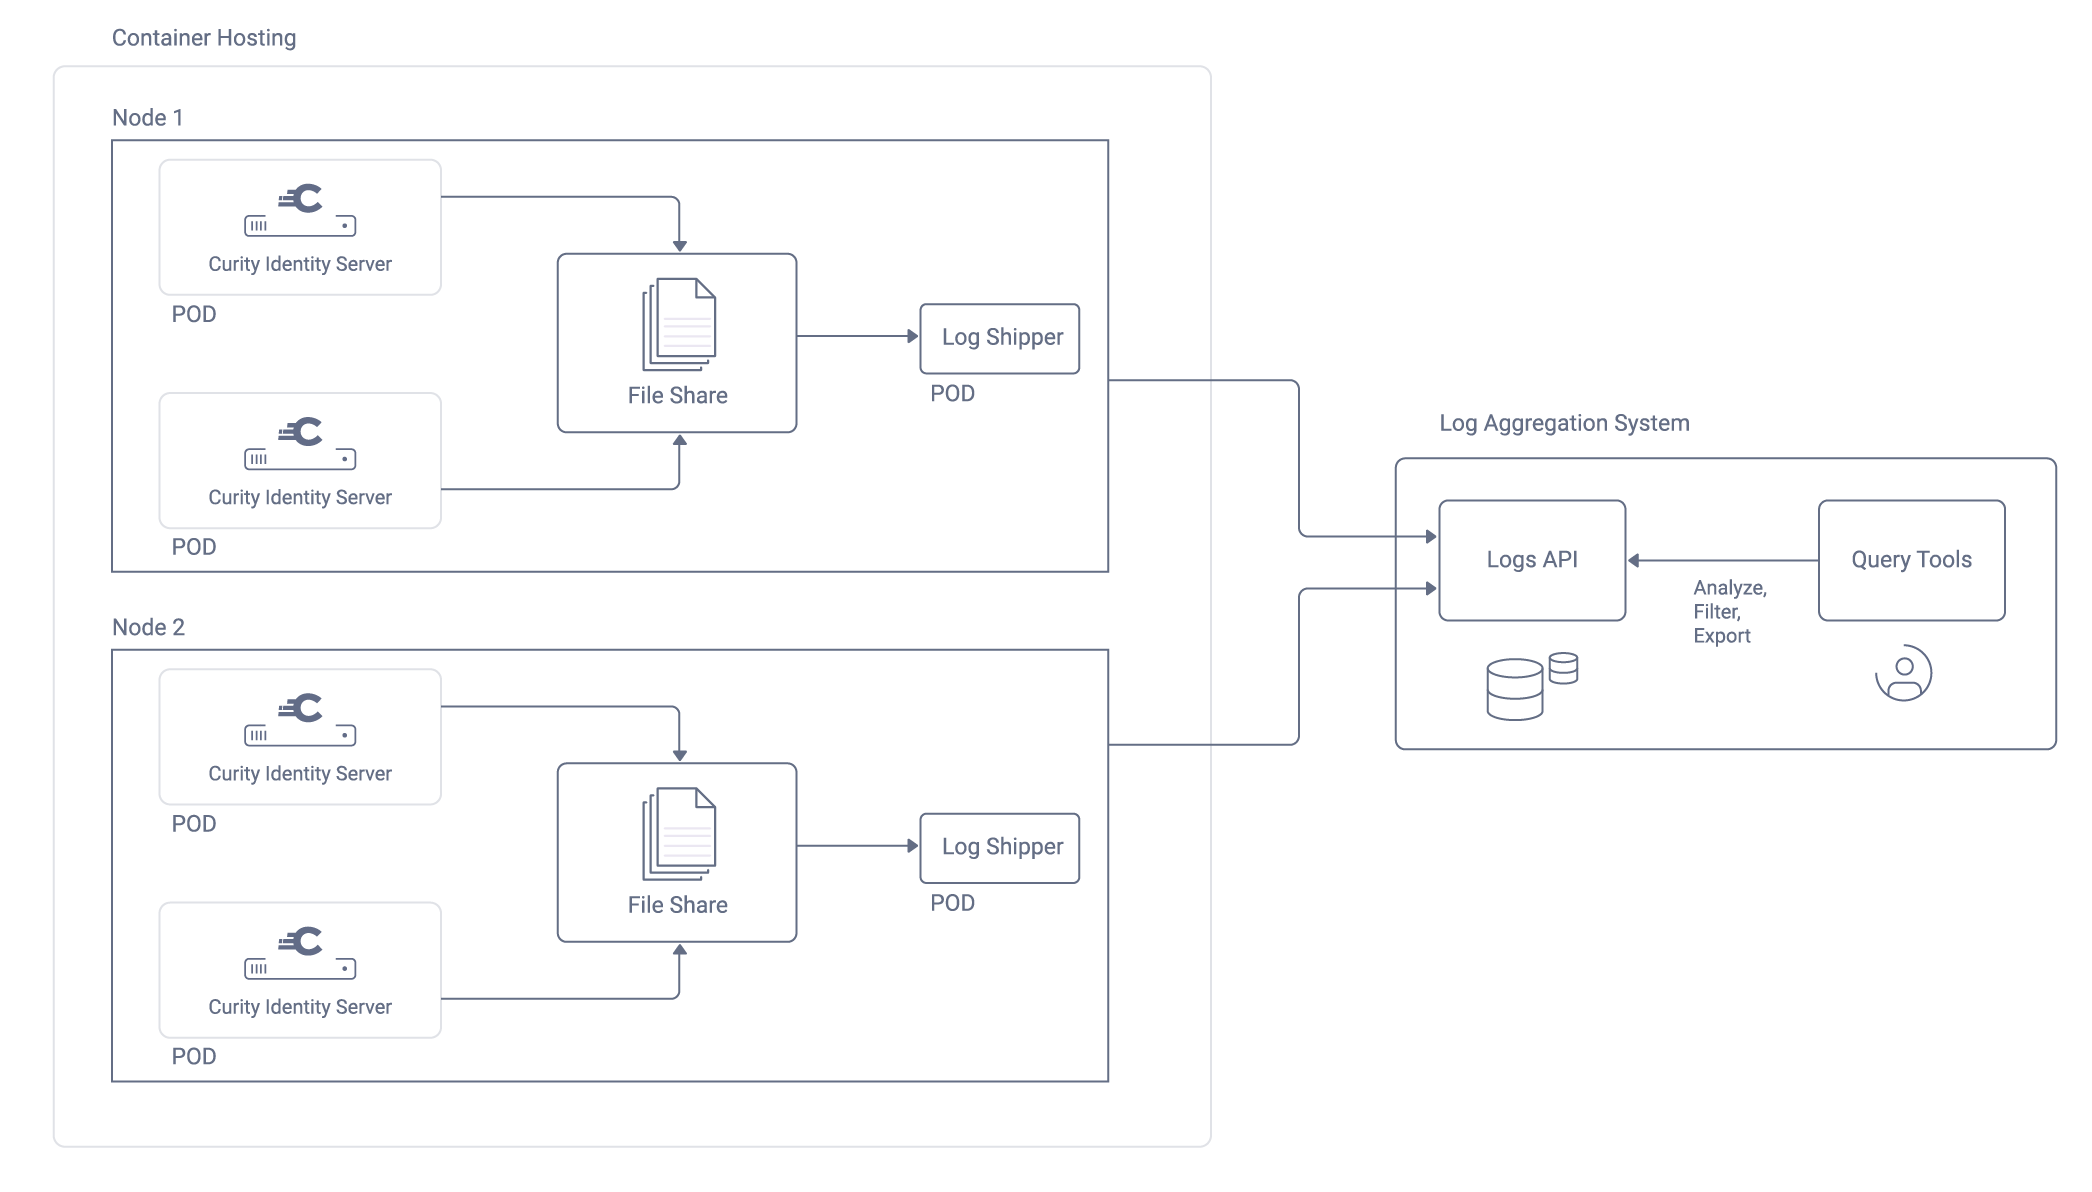
To integrate with a log aggregation system, update the log4j2 configuration of the Curity Identity Server and plan a deployment. The following diagram shows some example components for a Kubernetes deployment.

The following table summarizes roles of components that enable log aggregation in a Kubernetes deployment. Similar component roles should enable log aggregation on any other platform.
| Component | Behavior |
|---|---|
| Node | Each Kubernetes Node acts a virtual machine that hosts many pods. |
| Pod | Each runtime workload of the Curity Identity Server is a Docker container that runs within a pod. |
| Log Data | The platform saves log output to a known folder on Kubernetes nodes to make log shipping straightforward. |
| Log Shipper | Log shippers run in their own Docker containers and pick up logs from a file share on Kubernetes nodes. |
JSON Log Formats
To use log aggregation, a JSON Layout provides an easy to use option that maintains the types of each logging field. Each output row uses a bare JSON format that log shippers can easily read. The following example outputs the time of the logging event as a Unix epoch time and adds a hostname field to identify the particular instance of the Curity Identity Server that writes each logging event.
<JSONLayout compact="true" eventEol="true" properties="true" includeTimeMillis="true"><KeyValuePair key="hostname" value="${env:HOSTNAME}" /></JSONLayout>
The following example logging events shows some source logs formats for system, request and audit logs.
The system log's message field can include a text message or key value pairs. The following logging event resulted from intentional misconfiguration of a data source connection. Exception events can lead to multiple logging events. Some may have a stack trace and others may contain key value pairs with additional details.
{"timeMillis": 1741275691,"thread": "req-189","level": "WARN","loggerName": "se.curity.identityserver.errors.SystemRuntimeException","message": "se.curity.identityserver.errors.SystemRuntimeException@8b67fc[_httpStatus=500,_errorMessageId=system.status.internal.error,_errorCode=generic_error,_errorDescription=FATAL: database \"idsvr2\" does not exist]","endOfBatch": true,"loggerFqcn": "org.apache.logging.slf4j.Log4jLogger","contextMap": {"LongSessionId": "84aeadea-01cb-4431-bd55-282196a98202","RequestId": "kCPDgMRP","SessionId": "84aeadea","SpanId": "ca8578c5279899bb","TraceId": "2dddaab2003090620ad72cc856b93b9b"},"threadId": 42,"threadPriority": 5,"hostname": "curity-idsvr-runtime-6ccbf9799f-rgrrk"}
Customize JSON Log Formats
For more complete control over JSON log Formats consider the JSON Template Layout and deploy the log4j-layout-template-json library to the $IDSVR/lib folder of the Curity Identity Server.
Tailing Log Files
In a Kubernetes deployment of the Curity Identity Server, the platform captures system logs from stdout. Each pod's output saves to a /var/log/containers folder on the Kubernetes node that hosts the pod.
The article Using Log4j in Cloud Enabled Applications explains a technique where a sidecar container runs the Linux tail command to write secondary log files to stdout, so that those log events also save to Kubernetes Nodes.
Activate this behavior with the Helm chart for the Curity Identity Server. Select the stdout:true setting and indicate the loggers whose output you want to save to Kubernetes nodes. The following example adds sidecars to tail request and audit logs to stdout:
runtime:role: defaultservice:type: ClusterIPport: 8443logging:image: "busybox:latest"level: INFOstdout: truelogs:- request- audit# - cluster# - confsvc# - confsvc-internal# - post-commit-scripts
Runtime workloads of the Curity Identity Server then run as multi-container pods. Run the kubectl describe command against a runtime workload to inspect all containers in the Pod.
Log Ingestion
When log aggregation systems receive logging events they ingest log data and can apply logic to transform incoming logs to custom formats. Each type of log data should save to a different location or index in the log aggregation system, so that roles can be granted access to particular indices:
- System logs save to a
systemindex. - Request logs save to a
requestindex. - Audit logs save to an
auditindex.
Log ingestion logic should also maintain the data types of each field from the source log data to enable the best analysis later. The following examples demonstrate log usage with type-safe fields:
- An HTTP request
durationfield should be a number so that you can easily perform actions like sorting logs by the slowest requests. - The time of a logging event should be a date so that you can easily perform actions like filtering logs for a particular time period.
The following example structured logs show one possible format for clean and type-safe log data after ingestion.
{"eventTime": "2025-03-06T15:41:31.000Z","loggerFqcn": "org.apache.logging.slf4j.Log4jLogger","level": "WARN","endOfBatch": true,"thread": "req-189","threadPriority": 5,"threadId": 42,"hostname": "curity-idsvr-runtime-6ccbf9799f-rgrrk","system": {"errorCode": "generic_error","errorMessageId": "system.status.internal.error","errorDescription": "FATAL: database idsvr2 does not exist","type": "se.curity.identityserver.errors.SystemRuntimeException@8b67fc","httpStatus": 500},"contextMap": {"LongSessionId": "84aeadea-01cb-4431-bd55-282196a98202","RequestId": "kCPDgMRP","SessionId": "84aeadea","SpanId": "ca8578c5279899bb","TraceId": "2dddaab2003090620ad72cc856b93b9b"}}
Use Live Log Analysis
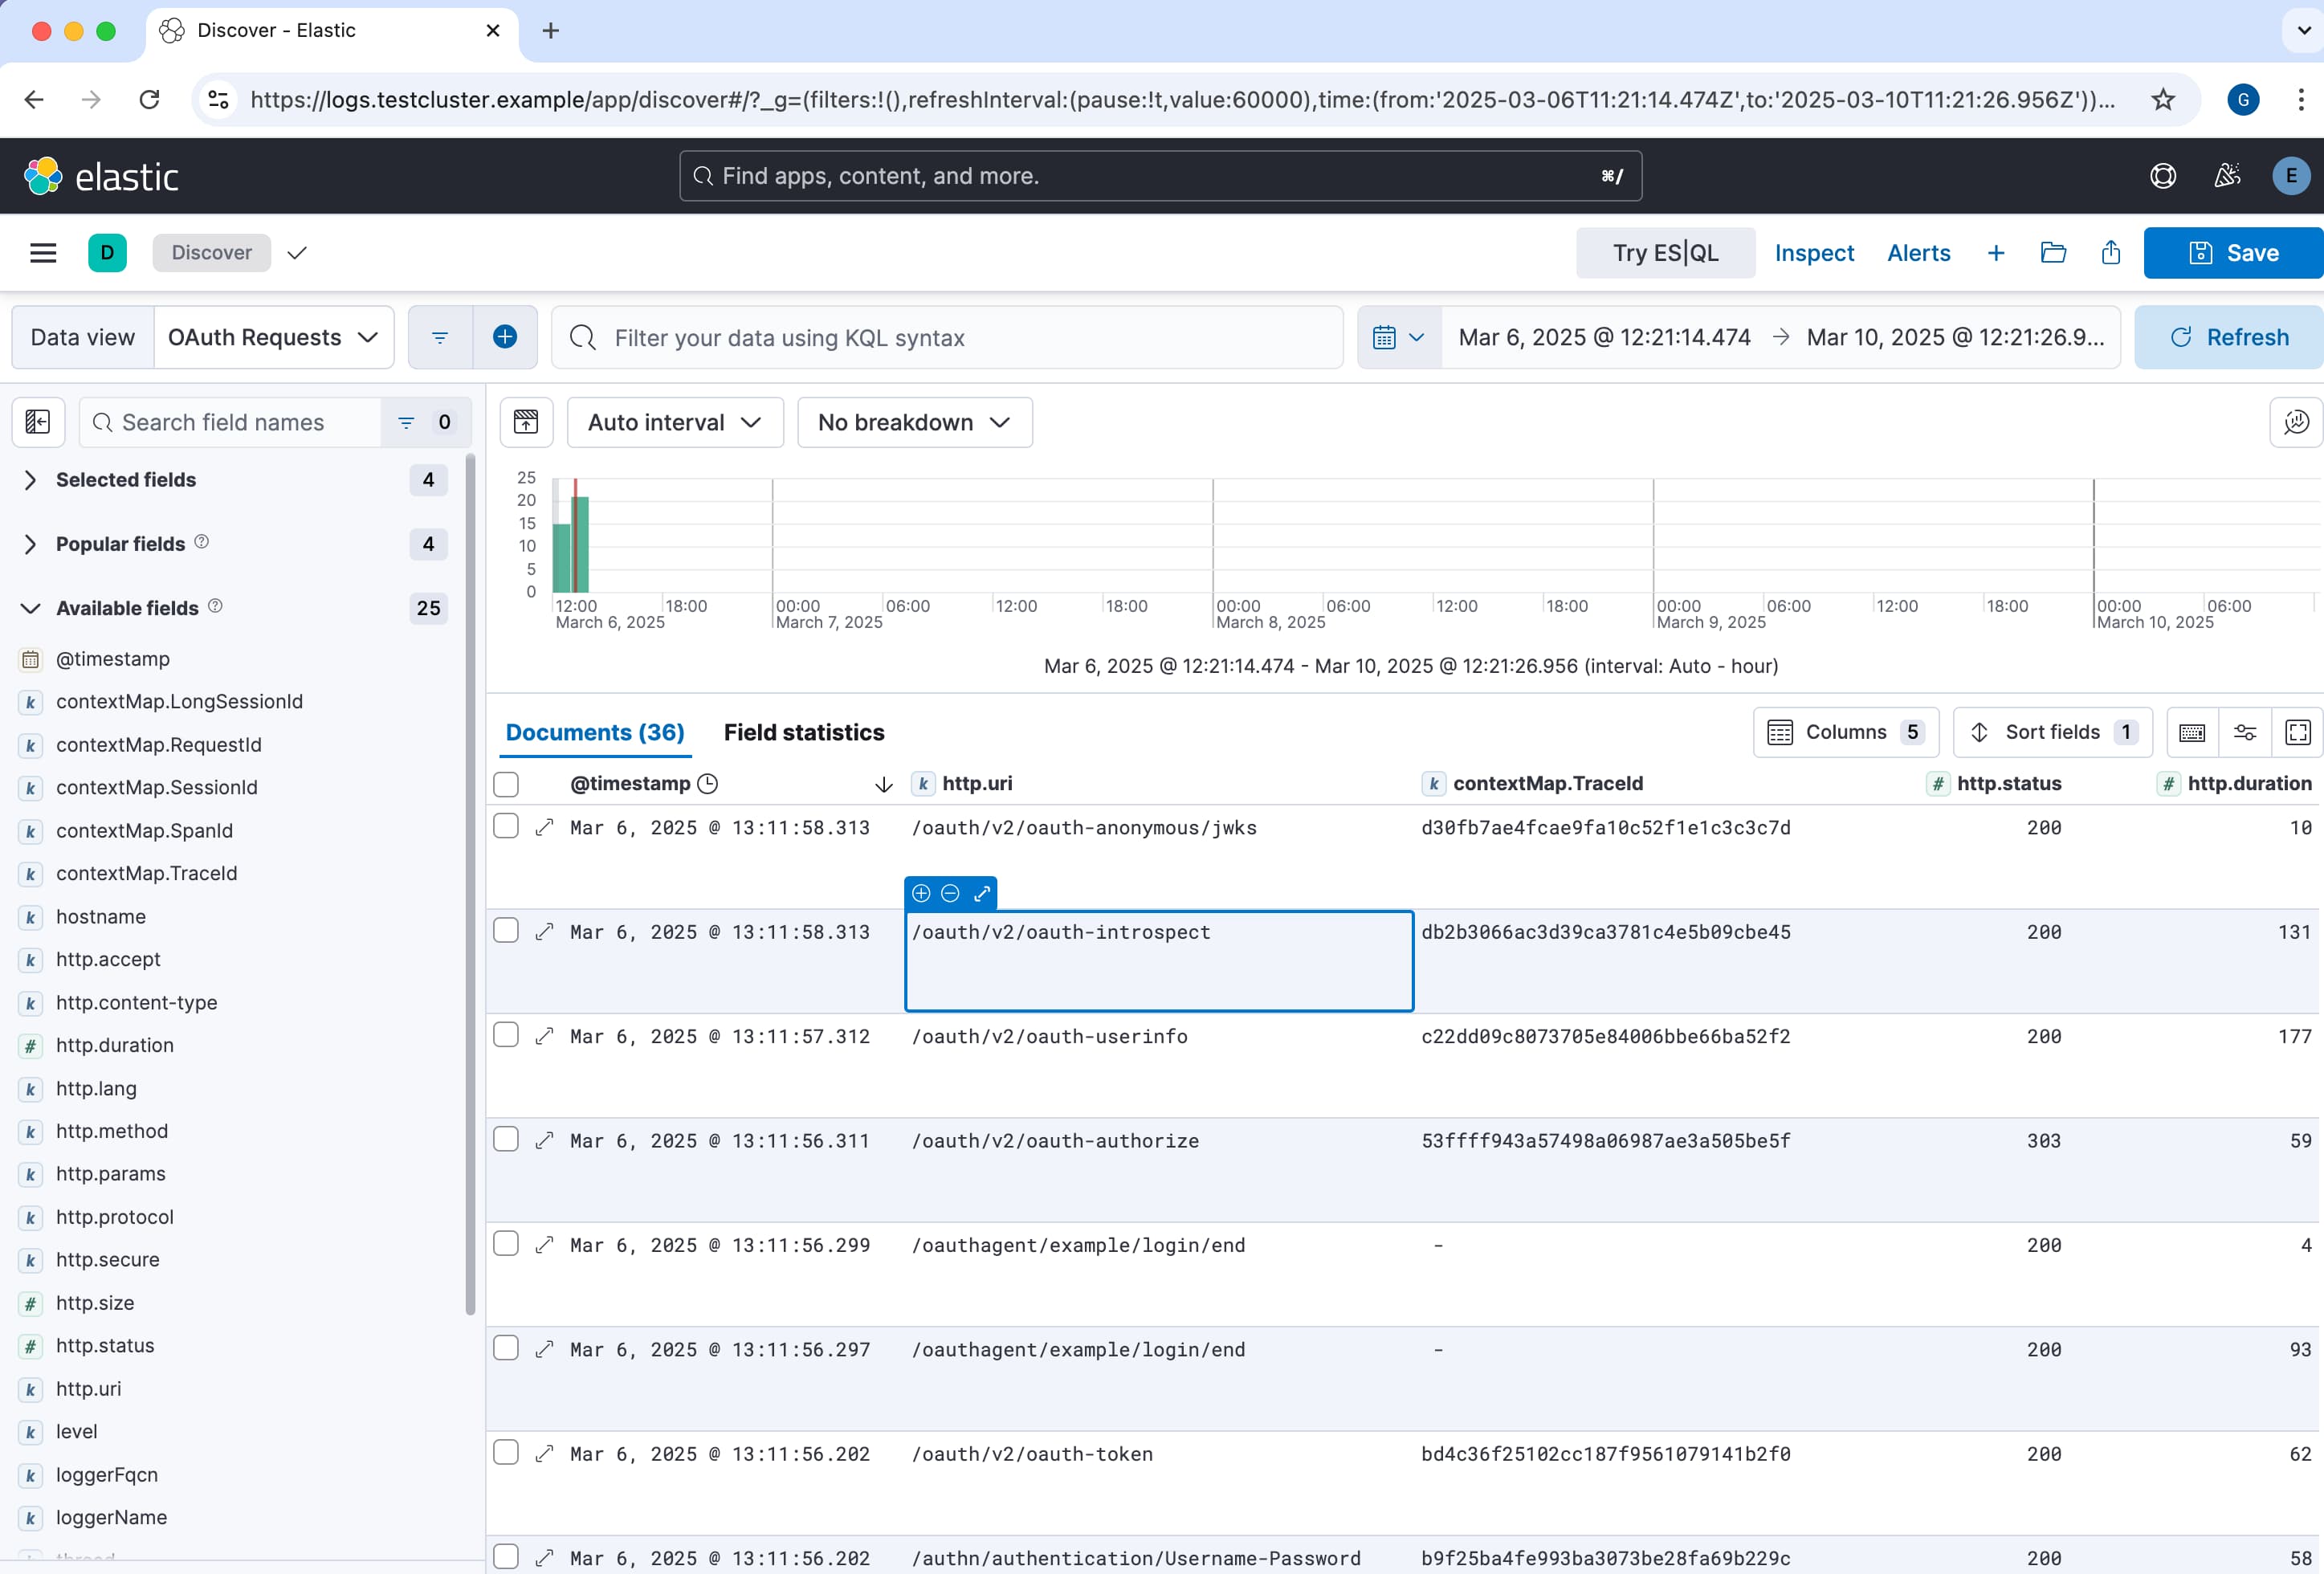
Log aggregation systems support user authentication and role-based authorization, to enable roles to be granted access to different types of data. Authorized users can use visualization features to view aggregated logs in real-time. The following example screenshot shows the Discover feature of Elasticsearch and Kibana, to provide live analysis of aggregated log data.

Users should also be able to query logs in powerful ways, such as with SQL-like filtering, sorting and grouping. The following pseudo queries demonstrate fast lookup with an OpenTelemetry trace ID, filtering request logs on server errors and finding audit logs to entries for a particular user.
SELECT * from system_logs WHERE contextMap.TraceId='ce41b85c6f00f167baa53fd814d23c30'SELECT TOP 10 * from request_logs WHERE request.statusCode >= 500 ORDER BY eventTime DESCSELECT * from audit_logs WHERE audit.subject='johndoe' AND eventTime BETWEEN '2025-03-05' and '2025-03-06'
Example Deployment
The Elasticsearch Log Aggregation tutorial provides a deployment example for a local Kubernetes cluster that uses logging best practices. First, the Curity Identity Server uses JSON logs which sidecars tail so that all logs save to Kubernetes nodes. Next, the Filebeat log shipper sends logs to the Elasticsearch log aggregation API, which ingests them.. Finally, the Kibana log analysis frontend enables visualization and field-by-field queries on the log data.
Conclusion
The Curity Identity Server has a modern logging architecture that enables you to visualize security events and troubleshoot issues using standard logging design patterns. Aim for a setup where you can issue live real time queries across the whole cluster, for the fastest time to analyze.

Join our Newsletter
Get the latest on identity management, API Security and authentication straight to your inbox.

Start Free Trial
Try the Curity Identity Server for Free. Get up and running in 10 minutes.
Start Free TrialWas this helpful?