The Grafana Dashboard for the Curity Identity Server
On this page
An Identity Access Management (IAM) system is a critical component in your backend architecture. Consequently, understanding and monitoring the health and status of the system is an important capability because it helps to detect, predict and mitigate problems to further avoid outages. This requirement exists whether the IAM system is consumed using Identity as a Service (IDaaS), using cloud infrastructure or on premise.
The Curity Identity Server provides Prometheus-compliant metrics suitable for monitoring. Grafana can be used to run queries over the metrics collected by a Prometheus instance and visualize the results. To facilitate the initial setup, Curity provides a Grafana dashboard with panels that aggregate important metrics.
By default, the Curity Identity Server publishes its metrics at :4466/metrics. Make sure, you add targets for the Curity Identity Server metrics to Prometheus and add Prometheus as a data source in Grafana. Configuring Prometheus and Grafana is out of scope of this article. See the respective documentation for Prometheus and Grafana.
Compatibility
The Grafana dashboard version 3.0.0 requires Grafana 9.6.1. Importing the dashboard with an older version of Grafana results in errors.
This tutorial explains how to read and use the Grafana Dashboard for the Curity Identity Server.
Monitoring Clusters and Instances
If you run several clusters of the Curity Identity Server, you can set up a Prometheus server for each cluster and add them as data sources in Grafana. The Grafana dashboard for the Curity Identity Server can, when required, scale to more complex setups, with multiple clusters. You can select the cluster instance of the Prometheus server in the cluster drop-down ① of the dashboard.
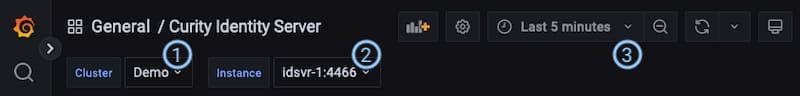
In addition, the dashboard also allows you to switch between the instances of the Curity Identity Server in the cluster by selecting one from the corresponding drop-down ②. Curity's Grafana dashboard has several sections some of which change based on the selection.
Take the selected range ③ of the dashboard into account. This is the timeframe most of the values refer to, e.g. "number of authentications in the last five minutes", "average CPU load over the last five minutes", etc.
Cluster Status - All Instances
The first section at the dashboard refers to the whole cluster and does not change when switching instance. It provides the overall summary of the status of the cluster.
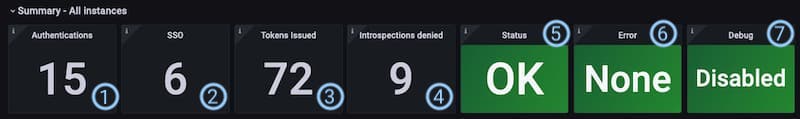
① Authentications: This panel shows the number of authentication events that Prometheus recorded during the selected time range of the dashboard. The result is the sum over the values reported from all instances. For example, the dashboard from the screenshot above had a time range of the last 5 minutes, thus it shows that there were in total 15 new logins during the last 5 minutes. The underlying metric is called idsvr_authentication_login_total.
② SSO: The number presents new single-sign-on events that were recorded by all instances during the selected time range. The example above reads that 6 new single sign-on events occurred in the past 5 minutes. The underlying metric is idsvr_authentication_sso_total.
③ Tokens Issued: The value shows the total number of OAuth and OpenID Connect tokens (access, refresh and ID tokens) issued during the selected time range of the dashboard. It represents the number of tokens issued by all instances during that time. In the above screenshot two instances issued 72 tokens during the last five minutes. The number is calculated from the metric called idsvr_oauth_token_issued_total.
Authentications, SSO and Tokens Issued give you an indication of how busy the system is (or was) in a given time range.
④ Introspection Denied: This number indicates that there were requests that attempted to introspect a token using application/jwt and that such requests were denied because the presented token was inactive (e.g. expired or revoked). Token introspection with application/jwt is used for token exchange and in particular when implementing the phantom token approach. It is expected for access tokens to expire when using the phantom token pattern. The underlying metric is called idsvr_oauth_introspection_denied_total.
Decreasing Values
Note, that the numbers can go down when no new events are recorded, i.e. activity decreases. All of above are relative in time and numbers will drop if there are no changes observed during the selected time range of the dashboard. For example, if there were no new authentications in the past 5 minutes, the Authentication number would be 0.
⑤ Status: The Status box simply shows OK if all instances are up and running. It reports Down if any instance is down. The metric used is called up which is a Prometheus default metric for all targets.
⑥ Error: This indicator counts the number of error messages. It turns red if any of the instances reports to have written such a log message at any time. This should not happen. Consult the system logs for the Curity Identity Server to determine the underlying causes and seek help from Curity support if your instances log such messages. The underlying metric is called log4j_appender_total where the label level equals error or fatal.
⑦ Debug: If red, at least one of the instances logged a debug message in the past 5 minutes. This indicator helps you to detect if debug is enabled unintentionally. Debug and trace messages can have implications on the infrastructure (e.g. storage) or security as they reveal a lot of information even when masked. Do not turn on debug logs in production environments. This visualization uses the metric called log4j2_appender_total and filters for the levels debug and trace.
Instance Status
This section contains an overview of the status of an instance. The instance drop-down allows you to select multiple values and this section repeats for each selected instance.
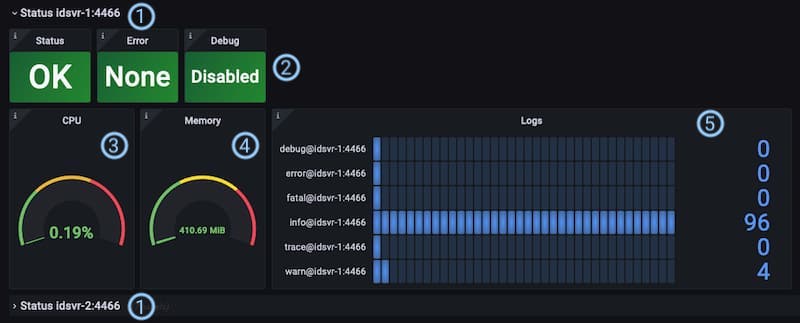
① The header shows the instance name to which the following panels refer to. The name is automatically added by Prometheus to all metrics from a given target.
② The indicators Status, Error and Debug are equal to the ones in the cluster status section but only related to a specific instance.
③ CPU: This panel shows the CPU usage in percent that the Java process running the Curity Identity Server instance reported at latest during the selected time range of the dashboard. The underlying metric is called idsvr_cpu_usage.
④ Memory: This visualization shows the reported total amount of memory in megabytes used by the Java process running the Curity Identity Server instance. The number shows the sum of the latest values for both heap and non-heap memory area reported during the selected time range of the dashboard. In normal usage the memory can remain at a moderately high level, though if it continues to grow that could be a sign of a memory leak, perhaps in a plugin. The underlying metric is called idsvr_jvm_memory_used.
⑤ Logs: The last value of the counter of the log messages based on the log level. Note, that the Debug indicator ② could be green even if the counter for debug messages reports some values. That is because the Debug indicator resets itself. In other words, it turns green if there have not been any new messages during the last five minutes, i.e. the debug log message counter has not changed for a while. The Error panel ②, on the other hand, lights red as long as the counter reports a value > 0. The underlying metric is called log4j_appender_total.
Performance Indicators
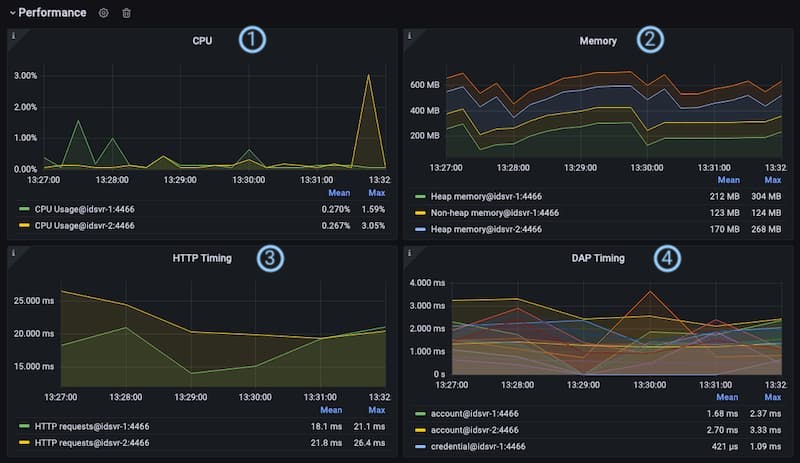
① CPU: This panel provides an overview of the CPU usage in percent of all selected instances during the selected time range of the dashboard. The underlying metric is called idsvr_cpu_usage. It lets you quickly check how busy the instances are and helps to identify bottlenecks.
② Memory: The graphs in this panel visualize the memory usage in MB of each selected instance. Each instance reports stats for heap and non-heap memory. With this kind of indicator, you can check the memory management of the instances. In normal usage the memory can remain at a moderately high level, though if it continues to grow that could be a sign of a memory leak, perhaps in a plugin. The underlying metric is called idsvr_jvm_memory_used. If you want to dig deeper into each memory area, remove the sum function from the query, i.e. change the query to (idsvr_jvm_memory_used{instance=~"$Instance"})
③ HTTP Timing: An important metric that directly impacts user experience is the time it takes to serve HTTP requests. This panel shows the average time in seconds that it takes an instance of the Curity Identity Server to process an HTTP request. The underlying metric is called idsvr_http_server_request_time.
④ DAP Timing: The Curity Identity Server integrates with various data sources. This panel provides an overview of how long it takes each instance of the Curity Identity Server in average to communicate with a certain type of data source. This indicator can help to identify problems with data sources in a certain context, e.g. when loading account data, writing tokens or others. There is such an metric for each type of data source. The underlying metrics are idsvr_datasource_account, idsvr_datasource_attribute, idsvr_datasource_credential, idsvr_datasource_delegation, idsvr_datasource_device, idsvr_datasource_nonce, idsvr_datasource_session, idsvr_datasource_token and idsvr_datasource_bucket. You may have separate monitoring outside this dashboard for data sources that can be helpful when investigating issues. For JDBC based data sources check out the JDBC Connection Pool section.
Use these metrics, for example, to find suitable settings for Autoscaling in Kubernetes.
Authentication Indicators
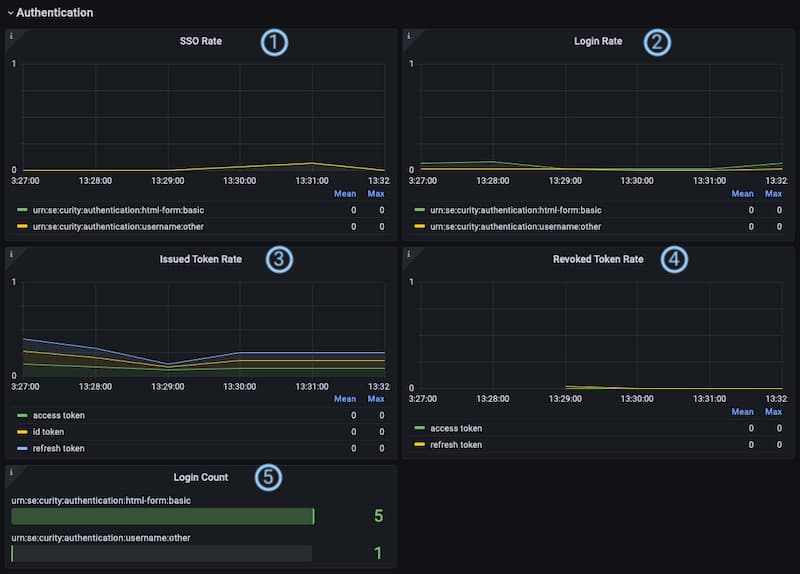
① SSO Rate: The graphs represent the SSO events per seconds in average over the selected range of the dashboard. The values are summarized per authentication method (acr) based on the metric idsvr_authentication_sso_total.
② Login Rate: This panel shows the average number of authentication events per second that occurred during the selected range of the dashboard. It aggregates the values per authentication method (act) and calculated from the metric idsvr_authentication_login_total.
③ Issued Token Rate: The issued token rate is the average number of issued tokens per type and second during the selected range of the dashboard. By default, there are at most three different types: acess, refresh and id. It depends on your setting, i.e. if your clients run OpenID and are allowed to receive refresh tokens or not. The underlying metric for the calculations is called idsvr_oauth_token_issued_total.
④ Revoked Token Rate: The Curity Identity Server reports the number of revoked tokens. This panel shows the average number of revocation events per token type and second. The underlying metric is called idsvr_oauth_token_revoked_total.
All the rates above give you some indication of what your system is busy with. If you have a homogeneous user group, you most likely experience certain peaks for example when users log in during the mornings or after lunch breaks. You can also use the panels to determine popular or busy login methods.
Both, the issued token rate and the revoked token rate include the client_id which allows you to analyze a certain client's behaviour. However, the label is not set by default and must be enabled if desired. To do so, set the system property se.curity:identity-server:reporting:include-client-id-label=true. See also the product documentation.
⑤ Login Count: This panel gives you a quick overview of the total number of login events per authentication method (acr) that were registered during the selected time range of the dashboard. It allows you to quickly determine how much a certain authentication method was used compared to others. The values are based on the metric idsvr_authentication_login_total
JDBC Connection Pool
Some plugins publish additional metrics. One example is the JDBC Data Source Plugin that can expose metrics of the underlying connection pool.
Enable Pool Metrics
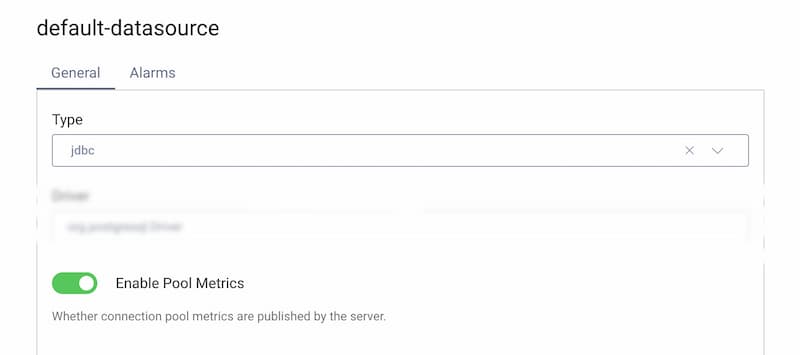
If you are using JDBC data sources and want to monitor them using the JDBC connection pool metrics, set the parameter enable-pool-metrics=true in the data source configuration, for example via one of the following methods.
Open the Facilities → Data Sources menu and identify the JDBC data source. Scroll down to the toggle Enable Pool Metrics and enable it. Commit the changes.
When a JDBC data source is configured to expose pool metrics you can use the Grafana dashboard to analyze the data.
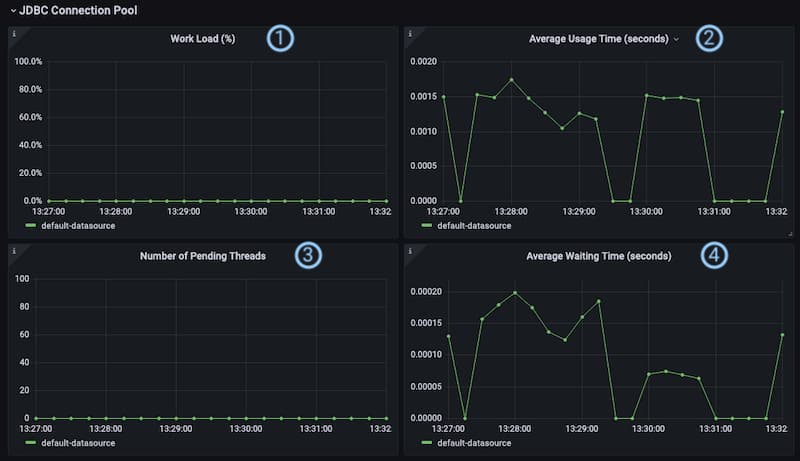
① Work Load: This shows the ratio of active connections compared to available connections of a certain data source in percent during the selected time range of the dashboard. I.e. if a data source has a connection pool with the size of 10 of which 5 connections are active, the work load is 50%. The metrics used in the calculation are idsvr_datasource_jdbc_pool_active_connections and idsvr_datasource_jdbc_pool_connections.
② Average Usage Time: This panel visualizes the average duration of processing queries for a certain data source. The underlying metric is called idsvr_datasource_jdbc_pool_connection_usage.
③ Number of Pending Threads: This graph simply visualizes how many threads were waiting for an available connection from the pool of a certain data source during the selected time range of the dashboard. If the pool is exhausted, i.e. the work load is at 100%, threads will have to wait for a connection to the effected data source. Values for the graph come from the metric called idsvr_datasource_jdbc_pool_pending_threads.
④ Average Waiting Time: The graph in this panel shows the average waiting time for a pending thread. If a thread does have to wait too long, time-outs may occur. Slower than expected times could indicate that the system is overloaded or that inefficient queries are being made, for example by plugins. The underlying metric is called idsvr_datasource_jdbc_pool_connection_acquired. Use the metric idsvr_datasource_jdbc_pool_connection_timeout_total to monitor time-outs (e.g. per seconds).
HTTP Clients Timing
Sometimes the Curity Identity Server needs to call other services. HTTP clients enable you to manage connections used for external HTTP calls, to control properties such as the scheme, authentication method, trust stores or cache behavior. If configured, HTTP clients publish metrics that allow for monitoring and analyzing external connections.
Enable Metrics for an HTTP Client
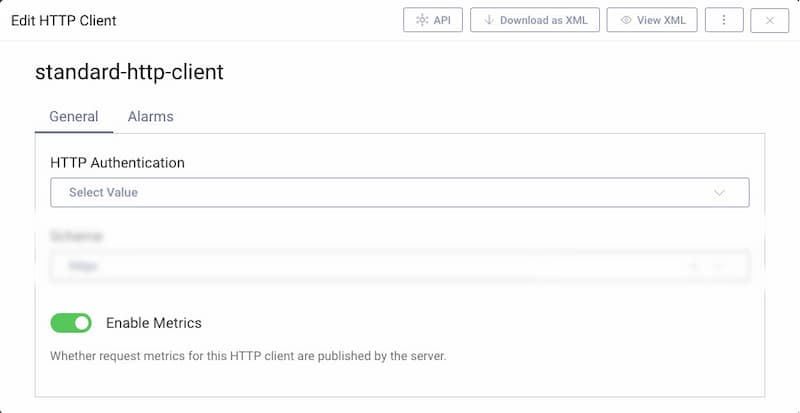
To enable an HTTP client to publish metrics, set the parameter enable-metrics=true in the configuration of the HTTP client, for example via one of the following methods.
Open the Facilities → HTTP Clients menu and identify the HTTP client. Scroll down to the toggle Enable Metrics and enable it. Commit the changes.
The Grafana dashboard for the Curity Identity Server includes a section that lists graphs that provide data about the average time that it takes an HTTP client to receive a response. There is a separate panel for each client.
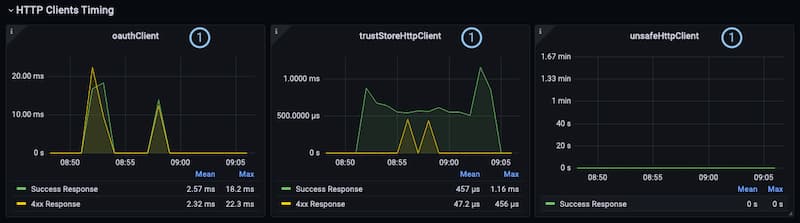
① HTTP Client ID: The panel for each client shows the timing information of success and error responses for that specific client. Each graph is a summary over all responses of all authorities, i.e. the HTTP servers that sent the responses. It visualizes the average time it takes the client to get a response. The metrics used for the panels are called idsvr_http_client_request_successful, idsvr_http_client_request_client_error and idsvr_http_client_request_server_error.
Conclusion
The Curity Identity Server exposes metrics using industry best practices. The Grafana dashboard is a good starting point for consuming the metrics of the Curity Identity Server. You can easily import it in your existing instance of Grafana and adapt it to your needs, add or modify panels and queries to fit exactly your use-case. All metrics are documented in the System and Operation Guide.
Customer Stories
Learn how organizations run identity and API security at scale.
Read customer storiesWas this helpful?