Kubernetes Auto Scaling
On this page
Overview
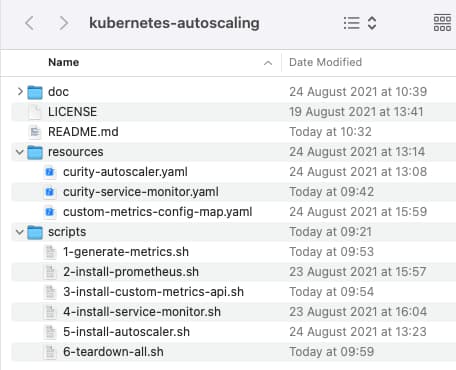
This tutorial shows how to autoscale runtime nodes of the Curity Identity Server based on its built-in custom metrics and the features of the Kubernetes platform. The system will run on a development computer if you clone the GitHub Repository linked above. This provides helper resources to automate the setup and teardown:
Built-in Auto Scaling
Kubernetes has built in autoscaling based on CPU and Memory usage, and this can be activated for runtime nodes, using the Helm Chart for the Curity Identity Server. To do so, you express one or both limits beyond which additional runtime nodes should be added:
autoscaling:enabled: trueminReplicas: 2maxReplicas: 4targetCPUUtilizationPercentage: 80targetMemoryUtilizationPercentage: 80
You then need to install the Metrics Server and you may also need to set the corresponding resource limits in the Helm Chart, based on the amount of CPU resource you wish to allocate to runtime nodes:
resources:limits:cpu: 500mrequests:cpu: 500m
Using Custom Requirements
This tutorial will instead use custom metrics, which enables you to define autoscaling based on your own requirements. The custom behavior will be based on OAuth request time, as an example custom metric that is important to the performance of your applications:
Desired State
When the Curity Identity Server's OAuth request time has averaged greater than 100 milliseconds for a warmup period, the system will automatically scale up. When the system returns to a level below 100 milliseconds for a cooldown period, the number of runtime nodes will automatically scale down.
Base Deployment
This tutorial provides some resources that can be added to a local Kubernetes cluster. For example, you can run the Curity Identity Server deployment from the Kubernetes Training repository. Before deploying the Curity Identity Server, locate the Helm values.yaml and update it to use autoscaling, with the following settings. The value expressed as a target is the 100ms threshold beyond which the system needs to start scaling up:
autoscaling:enabled: trueminReplicas: 2maxReplicas: 4targetCPUUtilizationPercentage: 0targetMemoryUtilizationPercentage: 0customMetrics:- type: Externalexternal:metric:name: idsvr_http_server_request_time_ratetarget:type: Valuevalue: 100m
The base system initially contains 2 runtime nodes for the Curity Identity Server, both of which provide Prometheus compliant metrics:
Query Metrics
Once the system is up, run the 1-generate-metrics.sh script, which runs 100 OAuth requests to authenticate via the Client Credentials Grant and displays the access tokens returned:
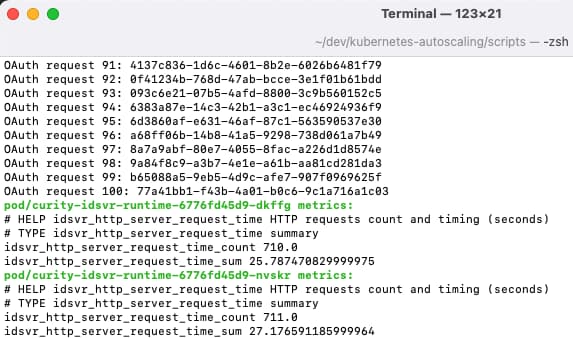
The script ends by using the kubectl tool to call the Curity Identity Server metrics endpoints directly, to get the fields used in this tutorial:
- idsvr_http_server_request_time_sum
- idsvr_http_server_request_time_count
Components
The monitoring system will frequently call the Identity Server metrics endpoints and store the results as a time series. The Kubernetes Horizontal Pod Autoscaler will then be configured to receive an overall result, so that it is informed when the number of nodes needs to change:
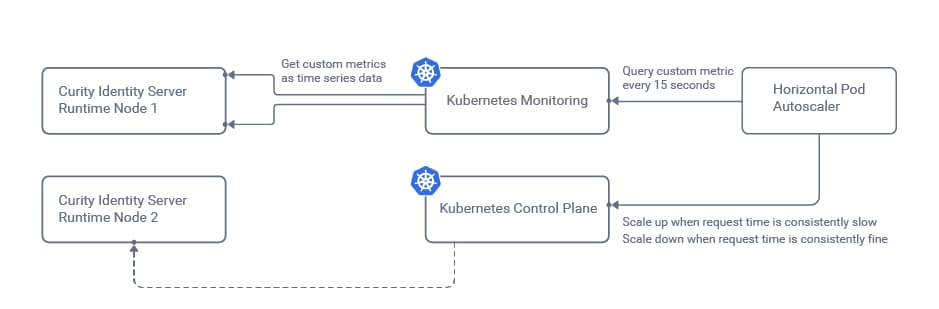
In this tutorial, Prometheus will be used as the monitoring system, and this requires us to install both the Prometheus system and also a Custom Metrics API, whose role is to transform values for the autoscaler:
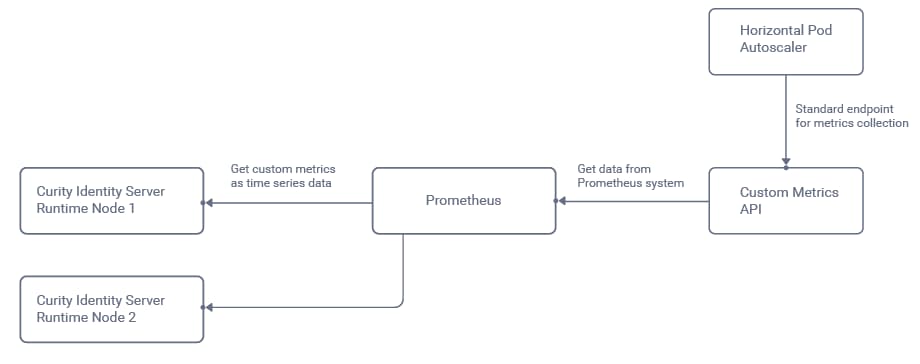
The autoscaler will receive a single aggregated rate value to represent the average OAuth request time for all runtime nodes in the cluster. The autoscaler will then compare this value to a threshold beyond which auto-scaling is needed.
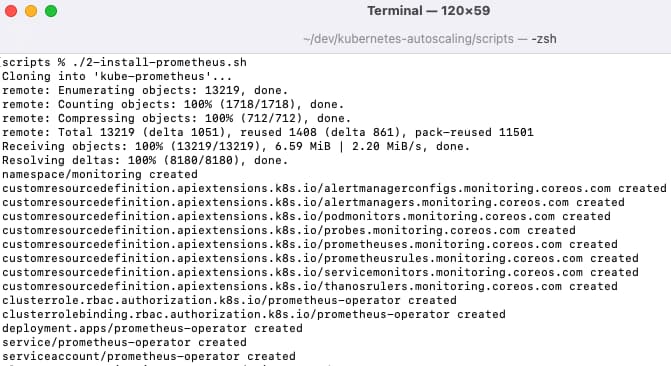
Install Prometheus
A fast installation of Prometheus components can be done by running the 2-install-prometheus.sh script from the helper resources, which deploys the Kube Prometheus System with default settings:
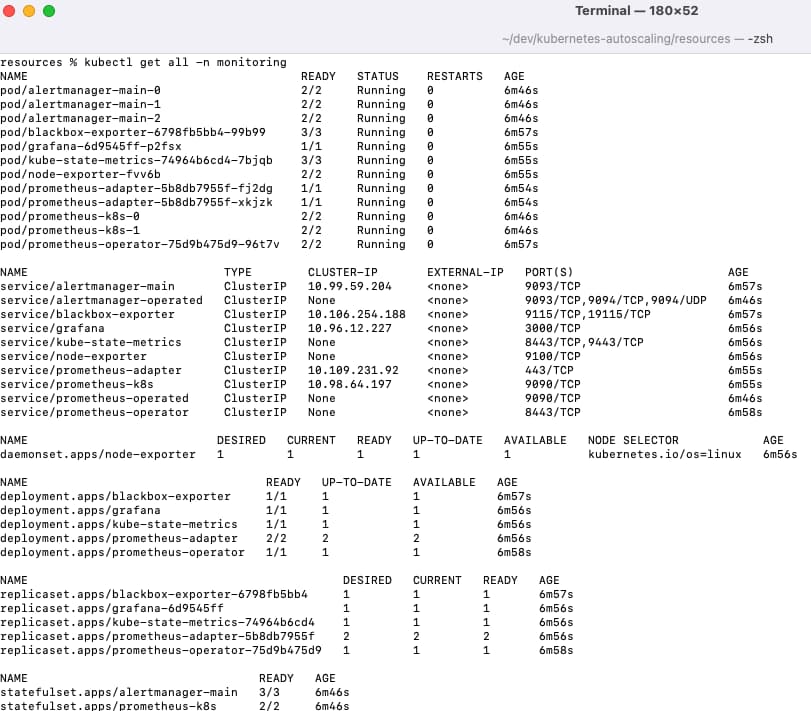
This deploys multiple components within a Kubernetes monitoring namespace:
The Prometheus Admin UI and the Grafana UI can both be exposed to the local computer via port forwarding commands:
kubectl -n monitoring port-forward svc/prometheus-k8s 9090kubectl -n monitoring port-forward svc/grafana 3000
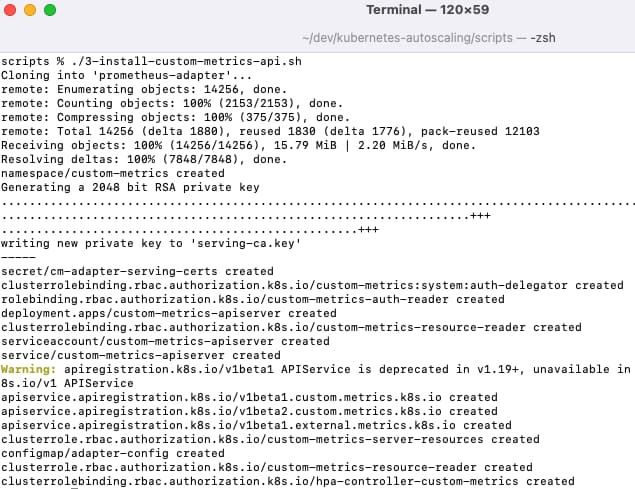
Install the Custom Metrics API
Next run the 3-install-custom-metrics-api.sh script, which will provide endpoints from which the Horizontal Pod Autoscaler gets metrics:
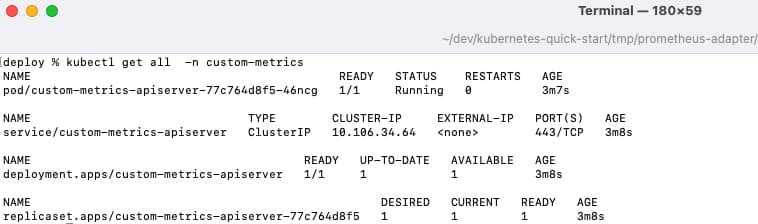
Once complete the Custom Metrics API components are available under a Kubernetes custom-metrics namespace:
kubectl get all -n custom-metrics
The following command can be run to verify that the custom metrics API is correctly communicating with Prometheus, and this should result in a large JSON response:
kubectl get --raw /apis/custom.metrics.k8s.io/v1beta1
The script adds the following custom entry to the Custom Metrics API's configmap, under an externalRules section, using a PromQL Query syntax:
- seriesQuery: '{namespace!="",__name__!~"^container_.*"}'resources:overrides:namespace:resource: namespacename:matches: "^(.*)$"as: "idsvr_http_server_request_time_rate"metricsQuery: 'sum(rate(idsvr_http_server_request_time_sum[5m])) / sum(rate(idsvr_http_server_request_time_count[5m]))'
Enable Metrics Collection
Next run the 4-install-service-monitor.sh script, which creates a Kubernetes ServiceMonitor resource that tells the Prometheus system to start collecting data from the Curity Identity Server's metrics endpoints:
kind: ServiceMonitorapiVersion: monitoring.coreos.com/v1metadata:name: curity-idsvr-runtimespec:selector:matchLabels:app.kubernetes.io/name: idsvrrole: curity-idsvr-runtimeendpoints:- port: metrics
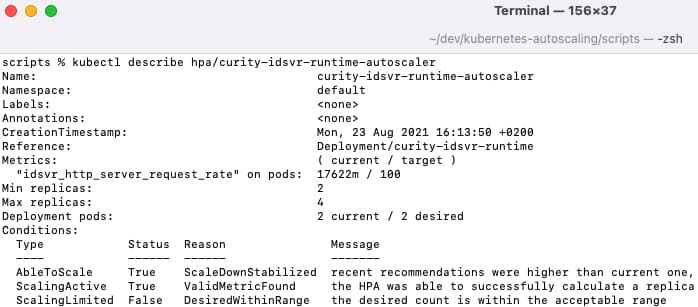
The initial state of the autoscaler, and the desired state can then be queried. This will look healthy, since the metric is well within its limits:
kubectl describe hpa/curity-idsvr
Collect Metrics
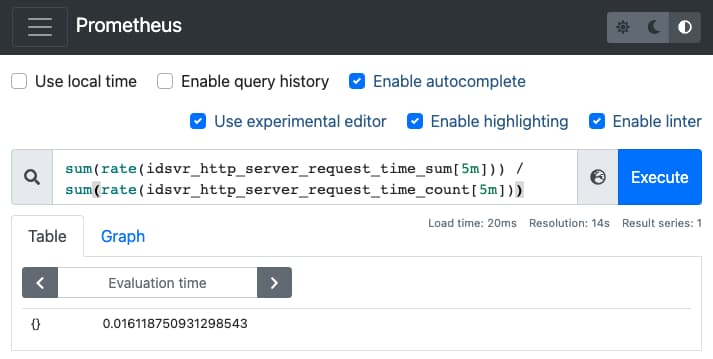
Autoscaling must be based on an accurate calculation, and this tutorial will use the following value, which gets the total request time across all nodes for the last 5 minutes, then divides it by the total number of requests from all nodes:
sum(rate(idsvr_http_server_request_time_sum[5m])) /sum(rate(idsvr_http_server_request_time_count[5m]))
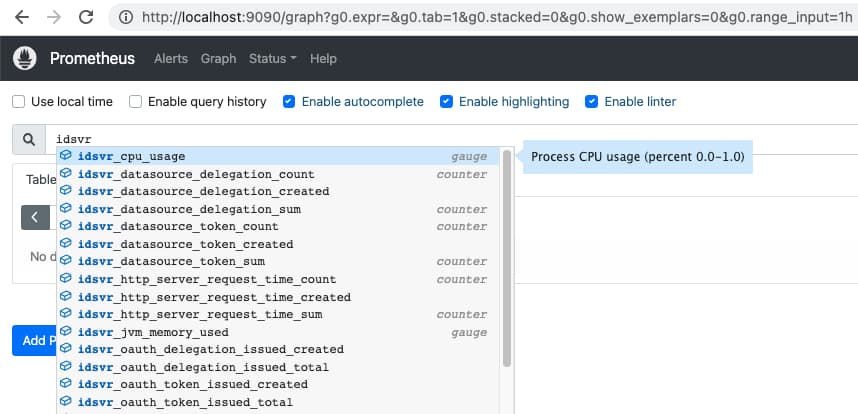
Next, run the 1-generate-metrics.sh script again, then navigate to the Prometheus UI at http://localhost:9090. Metrics from the Curity Identity Server will soon become available, and these will have an idsvr prefix:
Paste in the calculation and click Execute to see the average request time:
When there are no requests the query will return a not a number (NaN) or negative result. This is the standard behavior, but if preferred the calculation can be updated to return zero instead:
(sum(rate(idsvr_http_server_request_time_sum[5m])) /sum(rate(idsvr_http_server_request_time_count[5m])))> 0 or on() vector(0)
When troubleshooting, the raw and calculated metric values can be queried directly from the Custom Metrics API:
kubectl get --raw "/apis/custom.metrics.k8s.io/v1beta1/namespaces/default/pods/*/idsvr_http_server_request_time_sum" | jqkubectl get --raw "/apis/custom.metrics.k8s.io/v1beta1/namespaces/default/pods/*/idsvr_http_server_request_time_count" | jqkubectl get --raw "/apis/external.metrics.k8s.io/v1beta1/namespaces/default/idsvr_http_server_request_time_rate" | jq
Testing Autoscaling
Next login to the Admin UI that the base deployment installed. Navigate to Profiles / Token Service / Endpoints / Type=oauth-token / Client Credentials and select the New Procedure option, then paste in the following code before the statement that returns tokens, to simulate delayed performance:
var sleepMilliseconds = 200;var startTime = Date.now();var currentTime = null;do {currentTime = Date.now();} while (currentTime - startTime < sleepMilliseconds);
After committing changes, run the 1-generate-metrics.sh script again, and responses will now be slower. Describe the autoscaler again and you will see that the system has determined that it needs to scale up:
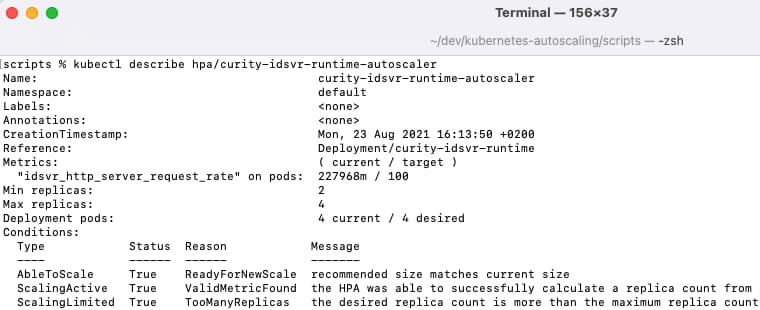
The algorithm for selecting the number of new nodes is explained in the Kubernetes Documentation:
desiredReplicas = ceil[currentReplicas * ( currentMetricValue / desiredMetricValue )]
Next undo and commit the above Javascript changes, and notice that after a few minutes of performance being comfortably within limits, the number of nodes is gradually scaled down again.
Tuning Autoscaling
The Kubernetes system deals with auto-scaling in a mature manner with these qualities:
| Aspect | Description |
|---|---|
| Phased Scaling | Kubernetes supports warm up and cool down delays to prevent 'thrashing', so that a metric value change does not instantly trigger spinning up of new nodes. |
| Extensibility | This tutorial's autoscaler could be easily extended to use multiple metrics. The desired replica count algorithm then selects the highest value from all included metrics. |
It is important to combine autoscaling with other checks on the system, and the below options are commonly used:
- A custom Grafana Dashboard can be imported as a JSON document, and used by technical staff to visualize the system state
- The Curity Alarm Subsystem can be used to raise alerts to people when a particular node performs poorly
- If the autoscaling metric is frequently flipping above and below its threshold then the default number of instances or the use of metrics may need to be further refined
Conclusion
The Curity Identity Server implements the industry standard solution for providing metrics about its runtime performance and use of resources. Results can then be supplied to monitoring systems, which will aggregate the results. One of the main use cases for metrics is to auto-scale the system if it is ever struggling under load, and any modern cloud native platform will support this.
Customer Stories
Learn how organizations run identity and API security at scale.
Read customer storiesWas this helpful?