How to Record a Browser Trace
On this page
When integrating OAuth into applications, the code flow is used. This involves a number of HTTP requests and responses. Sometimes it includes integration with third party systems, such as Microsoft Entra ID. In the event of an incorrect configuration, your identity experts may need to assist with troubleshooting. Capturing a browser trace enables them to visualize the HTTP requests and understand the cause.
A browser trace is a log of activity taking place in the browser when the browser is communicating with a web server running an application. The trace log captures activities such as requests sent to the server, how long it takes for a request to complete, responses to the requests and any errors that occur. With this, a browser trace gives a very detailed view of what is occurring as can give very detailed insight in troubleshooting an issue.
Your identity team, or the Curity support and Professional Services (PS) teams might request a browser trace log to be captured when troubleshooting an issue. Below are instructions that helps guide how to capture a browser trace log on some of the most common browsers.
Sensitive data
Data captured in browser trace logs could potentially contain sensitive data. Keep this in mind when recording the browser trace and when sharing the log. Refer to the Sanitation section below for details on how to sanitize potential sensitive data.
Capturing & Exporting the log
The most common browsers allow for a trace log to be captured as well as for that log to be exported in the HTTP Archive (HAR) format. This is the file format that will typically be requested by the Curity support and PS teams.
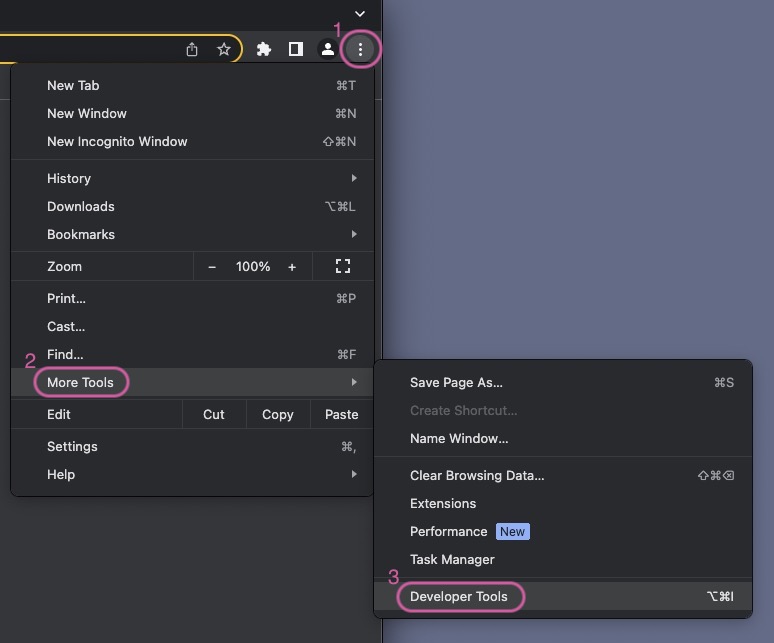
- Launch the developer tools from the toolbar menu (1) under More Tools (2) → Developer Tools (3)
-
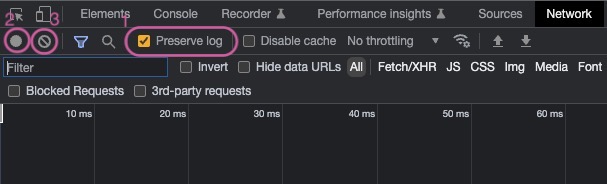
Configure the Developer Tools to preserve the log information. Navigate to the Network tab and enable
Preserve log(1).Then make sure to clear the log from any previously recorded activity so that a clean log of only the reproduced issue is captured. Still on the Network tab, select Stop recording network log (2). When stopped, the indicator (2) should not be red. Next, clear the potentially previously recorded information by clicking Clear (3).
-
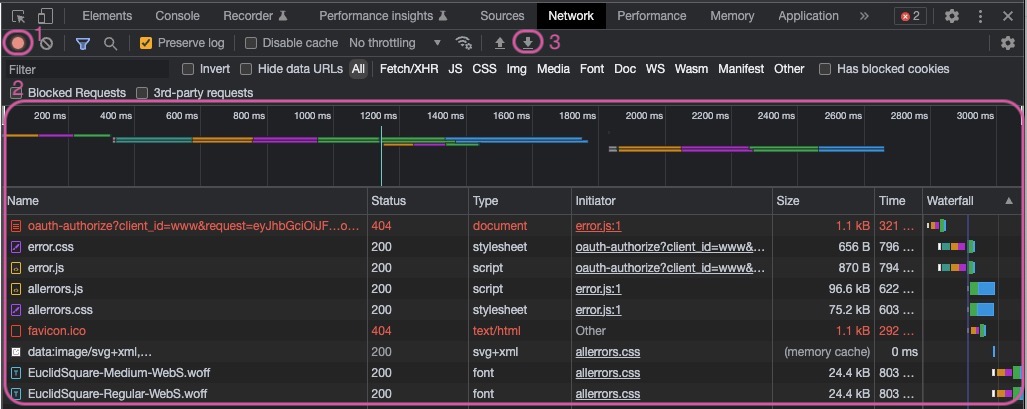
The state of the browser log should now be at a starting point with all previous activity cleared. Start to record the network log by clicking Record network log (1). When the recording is active the indicator should be red.
Now reproduce the issue you are troubleshooting and watch the log fill with activity (2).
The log data captured can be exported as a HAR file. Click the Export HAR… (3) button and choose a location and a filename to save the file.
Importing the Trace
Once a trace is captured it can be communicated to the identity experts, such as your IAM team or Curity support and professional services. They will use the import facility from developer tools or a 3rd party tool, to load the trace and inspect the HTTP messages. This should enable them to resolve the issue in a timely manner, typically by correcting the configuration.
Sanitation
The captured browser trace can contain sensitive information that you should sanitized before sharing the file with anyone. Typical data could include tokens, cookies, secrets and Personally Identifiable Information (PII).
There are several tools available that can automate the process of sanitizing the file. Google has an open source HAR Sanitizer for example. Use these tools at your own risk.
You can also manually sanitize the file. Open the file in a text editor of choice and search for the term that needs to be redacted. Make sure to make the search case insensitive so that you for example catch the term Authorization when searching for authorization. A list of key words to search for where the values can potentially contain sensitive data is outlined below. Note that other attributes could also contain sensitive information depending on what data you have captured in the trace.
- authorization
- password
- token
- access_token
- id_token
- refresh_token
- code
- code_verifier
- bearer
- passkey
- signature
- pem
- key
- state
Use these key words to search the captured trace and replace the value that these keys hold with something that is noting you have redacted the value, e.g. --- redacted ---.
Conclusion
Browser trace logs are sometimes a necessity in troubleshooting web applications. The most common browsers used today support capturing these detailed logs and also support exporting them in the HTTP Archive (HAR) format. The Curity support or Professional Services team might request this type of log when helping customers in troubleshooting specific issues.
Customer Stories
Learn how organizations run identity and API security at scale.
Read customer storiesWas this helpful?