Integrate Alarms with Cloud Monitoring
On this page
Overview
This tutorial shows how to report details of Curity Alarms to cloud monitoring systems. The solution uses AWS and consists of the following steps:
- A custom plugin receives alarm information from Curity
- The AWS SDK is used to send JSON data to the AWS Events Bridge
- Monitoring actions are defined in AWS to process the incoming events
Alarm Handler Plugin
The Java code for the plugin can be downloaded from the GitHub Repository. The alarm handler interface is called whenever the state of an alarm changes within the Curity Identity Server:
package se.curity.identityserver.sdk.alarm;public interface AlarmHandler {void handle(Alarm var1);}
The plugin code consists of a number of Java source files, and the role of each is summarised below:
| Class | Description |
|---|---|
| Configuration | Values that are configured in the Curity Identity Server |
| Alarm Handler | The alarm handler custom implementation, which uses the AWS SDK |
| Descriptor | The descriptor is used by the plugin system to find and load the alarm handler class |
| Managed AWS Client | An object that is created and configured only once, to notify the AWS Events Bridge efficiently |
| Credentials Provider | An object responsible for providing AWS credentials in order for the remote call to succeed |
| JSON Formatter | A utility class to format data for the destination cloud system |
Development Setup
First ensure that the following resources are installed on the development machine:
- Java 8 SDK or later
- Maven
- AWS CLI
The Java project uses the AWS SDK, and AWS libraries are referenced in its pom.xml file:
<dependencyManagement><dependencies><dependency><groupId>software.amazon.awssdk</groupId><artifactId>bom</artifactId><version>${project.awssdkVersion}</version><type>pom</type><scope>import</scope></dependency></dependencies></dependencyManagement><dependencies><dependency><groupId>software.amazon.awssdk</groupId><artifactId>eventbridge</artifactId></dependency><dependency><groupId>software.amazon.awssdk</groupId><artifactId>sts</artifactId></dependency></dependencies>
Create an Events Bus in AWS
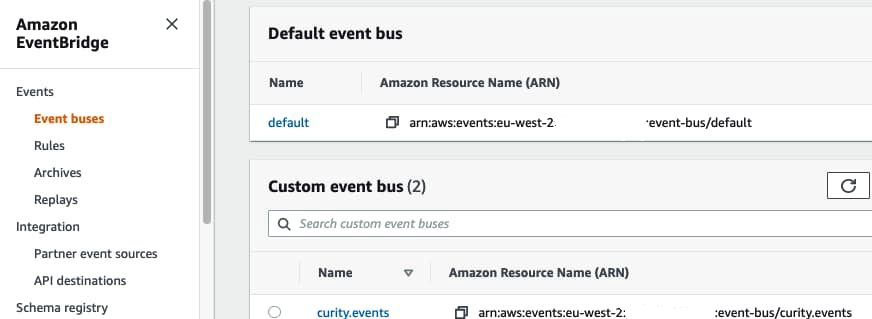
In the AWS Console, navigate to AWS Events Bridge and create a Custom Events Bus, named curity.events:
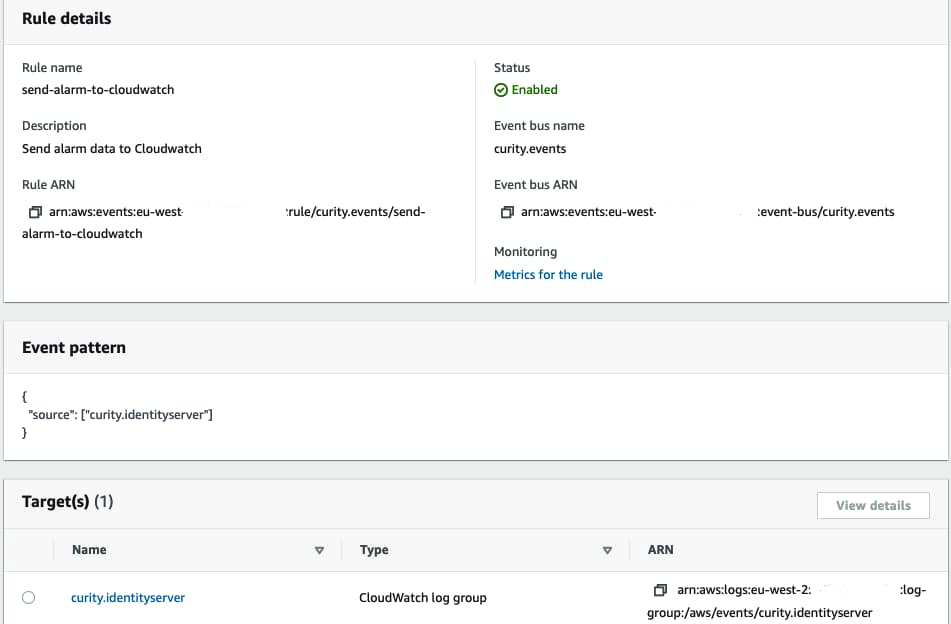
Next, add an Events Rule, along with a Target, to handle incoming messages. You can implement any custom logic here, such as publishing to an SNS topic or invoking a lambda function. This tutorial uses a simple option of saving data to Cloudwatch logs. Note that the rule must specify an Event Pattern in order to match incoming messages against a 'source' property.
Deploy the Plugin
To build the plugin's JAR files, run 'mvn package', to update the 'target' folder with the below library and all of its dependencies:
target/identityserver.plugins.alarmhandler.awseventsbridge-1.0.0.jar
Then create a plugin folder for alarm handlers in the Curity Identity Server and copy all of the the target/*.jar files there:
$IDSVR_ROOT/usr/share/plugins/<folder>
Activate the Plugin
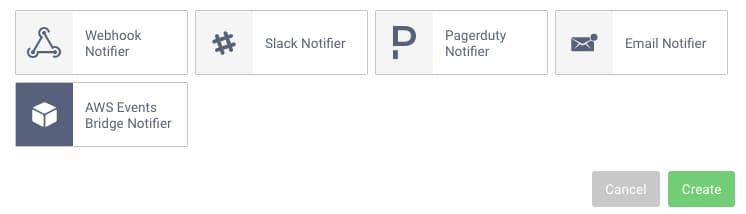
Restart the Curity Identity Server to load the plugin, after which there will be an additional option under Alarm Handlers in the Admin UI:
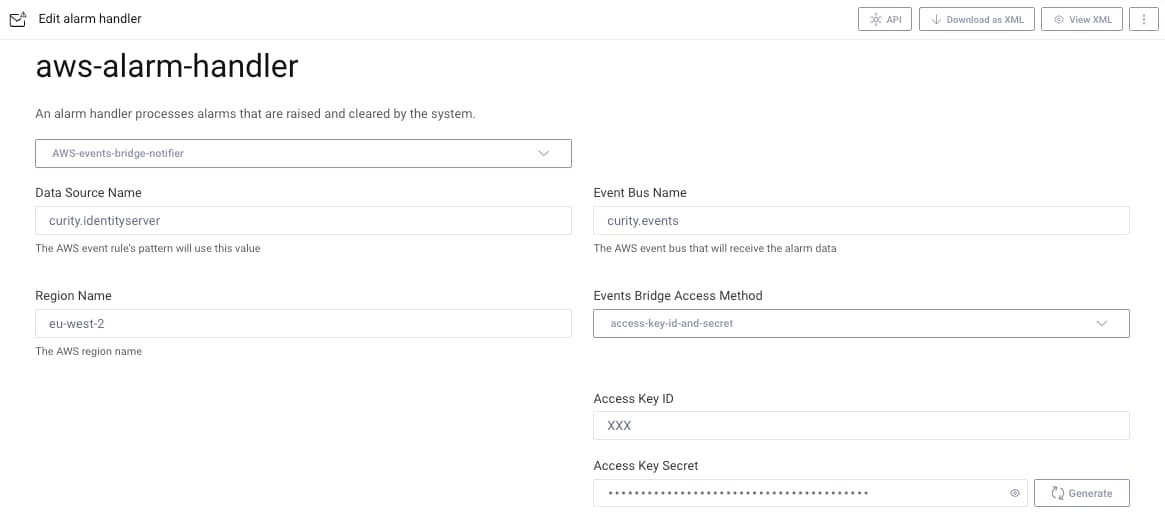
The alarm needs to be configured with properties from the plugin's configuration object, so ensure that these match the values that were configured in AWS. Various ways to connect to AWS are possible, and the following screenshot uses an access key ID and access key secret. In local development setups these values can be copied from your ~/.aws/credentials configuration file.
Test the Plugin
To test the plugin you can use the test option in the Admin UI. The following example simulates a failed connection from the Curity Identity Server to an external URL:
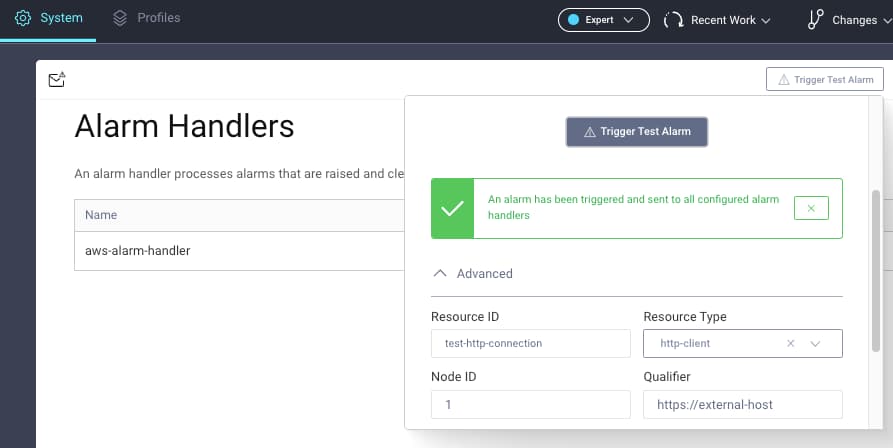
In AWS this will result in a JSON object being saved to Cloudwatch logs. This data is written by the plugin's JsonFormatter class:
{"version": "0","id": "00a1e355-b2e3-dfc1-3b89-1bcb16905174","detail-type": "alarm","source": "curity.identityserver","account": "XXX","time": "2023-04-06T08:17:31Z","region": "eu-west-2","resources": [],"detail": {"resource": "test-http-connection","qualifier": "https://external-host","service": "1","updated": "2023-04-06T08:17:31.605296673Z","severity": "CRITICAL","type": "EXTERNAL_SERVICE_FAILED_COMMUNICATION","text": "!! TEST ALARM !! failed-communication alarm raised for http-client test-http-connection"}}
Create a Cloudwatch Dashboard
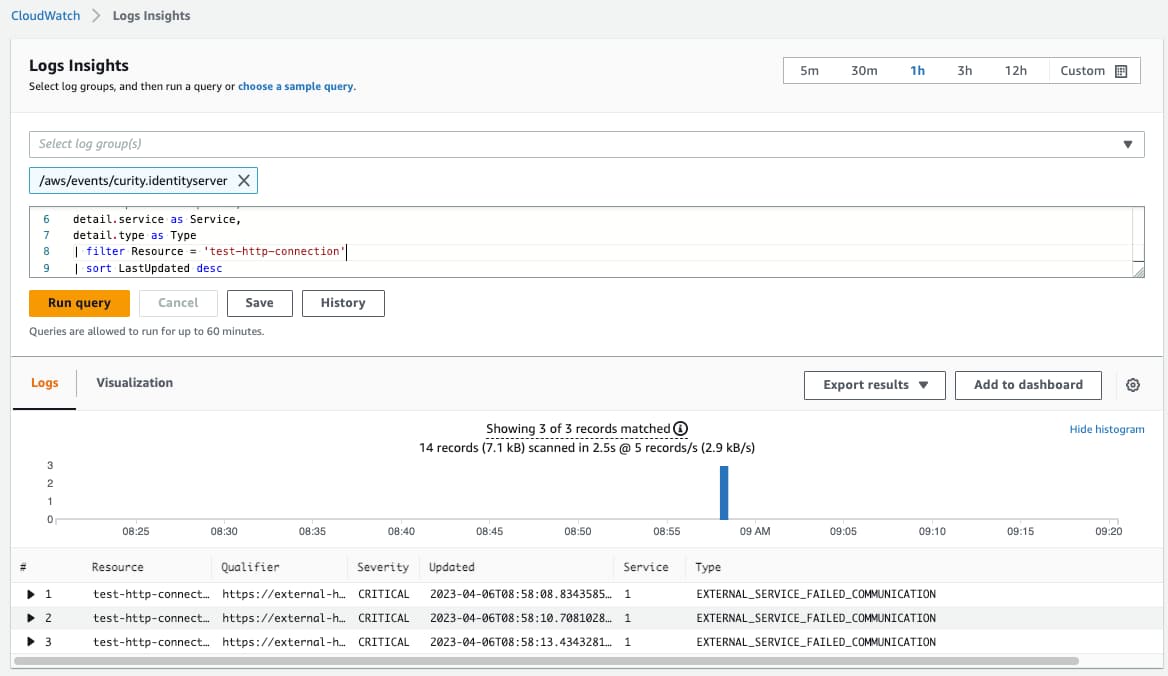
The JSON data saved to Cloudwatch is contained in each entry's @message object, and JSON fields within this object can be queried with a dot syntax, as explained in the Insights Query Documentation. A simple list query is provided here, for a one hour time period:
fieldsdetail.resource as Resource,detail.qualifier as Qualifier,detail.severity as Severity,detail.updated as Updated,detail.service as Service,detail.type as Type| filter Resource = 'test-http-connection'| sort LastUpdated desc
Paste this into an AWS Logs Insights query for the log group configured against the events bridge:
Then use the Add to Dashboard option to render recent results in a monitoring dashboard, which could also show other AWS widgets:
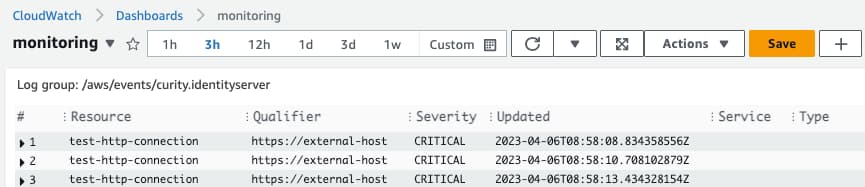
In normal circumstances, the widget would be empty. In the event of intermittent problems, the widget's time period could be changed to analyze the history, or the filter updated to focus on particular alarms.
Conclusion
Alarm handlers allow you to receive immediate notification when a dependency of the Curity Identity Server experiences problems. It is then straightforward to send error data to cloud monitoring systems and integrate with its features.
This tutorial provided basic visualization via a monitoring dashboard, though the incoming event and its alarm data could be handled in many additional ways. A common option would be to add a second event bus rule for alarm messages, whose role is to send people alerts.
Customer Stories
Learn how organizations run identity and API security at scale.
Read customer storiesWas this helpful?