
On this page
Starting from version 10.0 of the Curity Identity Server you can activate OpenTelemetry tracing. OpenTelemetry is a standards-based observability framework that components can use, regardless of their technology. With OpenTelemetry you own the observability data and can visualize or interrogate it using standard tools.
OpenTelemetry in OAuth Flows
OAuth flows often trigger calls to multiple backend components. When all of these components implement OpenTelemetry tracing, they follow the same pattern to enable correlation of related requests. The client can generate a unique TraceId and send it in a standardized traceparent header that upstream components consume.
All components in the trace should use Context Propagation, to add data as a span under the TraceId. A span is a child unit of work, like a child HTTP request. Each span has a unique SpanId within the trace and contains Resource Attributes. All backend components use an OpenTelemetry SDK that reports this data to the OpenTelemetry Collector.
The OpenTelemetry collector can distribute trace data to tools that specialize in visualizing it, such as Jaeger or Zipkin. For example, a visualization tool could accept a particular client TraceId and then render the entire trace from the OpenTelemetry data.
Open Telemetry in the Curity Identity Server
The System and Operation Guide explains the Curity Identity Server's current support for OpenTelemetry, which includes the following behaviors:
- Each incoming HTTP request creates a span under the parent trace.
- If there is no parent trace, the incoming HTTP request generates a new trace.
- Any outgoing HTTP requests create additional spans under the parent trace.
- Log output includes the
TraceIdandSpanIdfields, to enable log lookup.
Activate OpenTelemetry Tracing
To activate OpenTelemetry in the Curity Identity Server, navigate to System → General and toggle on the feature.
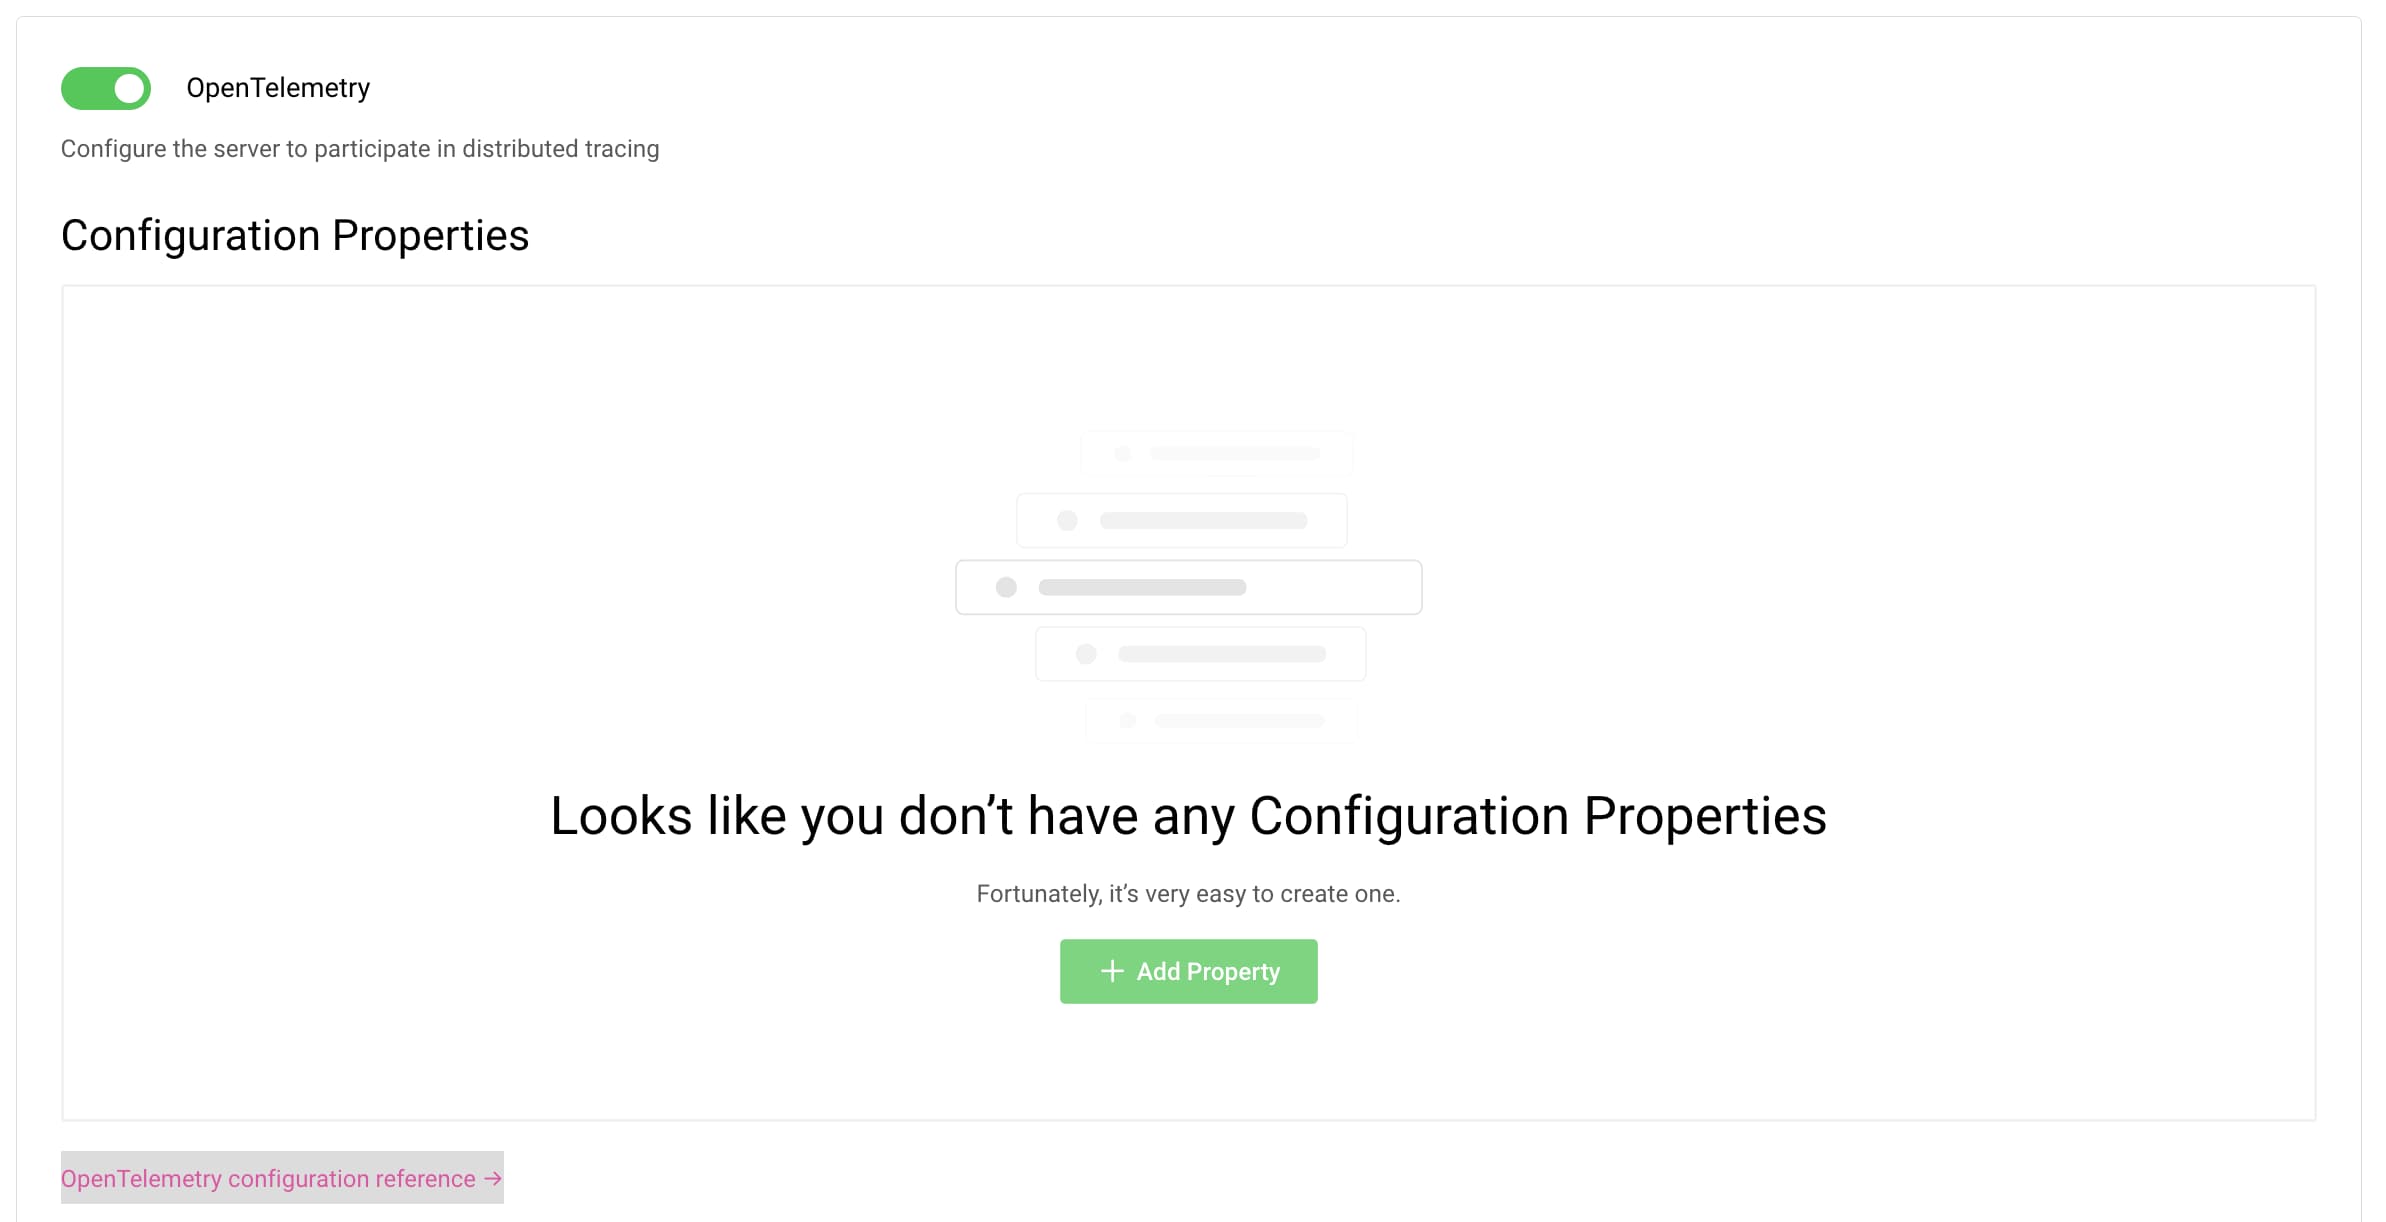
The Curity Identity Server uses the OpenTelemetry SDK with the Zero-code SDK autoconfigure module. You can provide your preferred OpenTelemetry SDK options. For example, the following settings enable exporting of trace data, with OpemTelemetry defaults for all other options:
- otel.traces.exporter=otlp
- otel.exporter.otlp.endpoint=
http://otel-collector:4317
In the Admin UI, use Changes → Commit to save and then Changes → Download to get the configuration of the Curity Identity Server in XML format. Inspect the XML file to see that the environment/telemetry section contains the OpenTelemetry settings.
<config xmlns="http://tail-f.com/ns/config/1.0"><environments xmlns="https://curity.se/ns/conf/base"><environment>...<telemetry><telemetry-provider><opentelemetry xmlns="https://curity.se/ns/ext-conf/opentelemetry"><property><name>otel.traces.exporter</name><value>otlp</value></property><property><name>otel.exporter.otlp.endpoint</name><value>http://otel-collector:4317</value></property></opentelemetry></telemetry-provider></telemetry></environment></environments>...</config>
Prepare Curity Identity Server Logs
The Curity Identity Server uses the log4j2 logging framework. Read about the concepts in Logging Best Practices. When the data for a log entry originates from an HTTP request it can include OpenTelemetry TraceId and SpanId fields.
- Each
loggerrepresents a category of data, like system logs, request logs and audit logs. - Each logger has one or more
appendersthat write tostdout, files or even databases. - Each appender has a
layoutthat determines the output format and fields to log. - The layout can include the OpenTelemetry
TraceIdandSpanIdin its output.
Most appenders use a pattern based layout by default, with columnar data. You need to configure the TraceId and SpanId fields as extra columns to include them in the output. Use the %X prefix as the following example shows.
<PatternLayout pattern="%date{yyyy-MM-dd'T'HH:mm:ss:SSSZ} %-5level {%thread} %logger %X{TraceId} %X{SpanId} %msg%n"/>
Alternatively, remove the default pattern layout and replace it with a JSON layout. The contextMap then contains the TraceId and SpanId fields so you should not need to use field-level configuration.
<JSONLayout compact="true" eventEol="true" properties="true" includeTimeMillis="true" />
The following example shows a JSON request log event that includes the TraceId and SpanId fields.
{"loggerFqcn" : "org.apache.logging.log4j.spi.AbstractLogger","level" : "INFO","thread" : "req-106","message" : "","threadPriority" : 5,"threadId" : 12,"hostname" : "curity-idsvr-runtime-7454859bbc-9r5js","http" : {"duration" : "403","protocol" : "HTTP/1.1","method" : "GET","size" : "383","content-type" : "application/vnd.auth+json","params" : "","secure" : "true","uri" : "/oauth/v2/oauth-authorize","accept" : "application/vnd.auth+json","status" : "200""contextMap" : {"RequestId" : "Lo0wiUp3","SpanId":"073a05b1c33cacc3","TraceId":"bbaadc1c1749c60237ae3cd8f3148101"},"loggerName" : "se.curity.identityserver.app.RequestReceiver","timestamp" : "2025-02-07T16:40:25.032+0000"}
OpenTelemetry Phantom Token Example
The GitHub link at the top of this page provides an example deployment that uses OpenTelemetry. The example uses the Phantom Token Pattern, where a request from the client first calls an API gateway with an opaque access token. An API gateway plugin introspects the opaque access token at the Curity Identity Server, which acts as the token service. The API gateway then forwards a JWT access token to the target API.

The example deployment uses the following main behaviors:
- The client sends a
traceparentHTTP header in the OpenTelemetry format, to provide the parentTraceId. - The API gateway, Curity Identity Server and an example Node.js API all contribute spans to the parent trace.
- The API integrates with the OpenTelemetry Node.js SDK.
- The OpenTelemetry Collector runs within the backend and receives trace data from components.
- The OpenTelemetry Collector exports trace data to an observability tool that people can use to interrogate trace data.
Study the README files in the GitHub repository to understand the key points of the integration. The following screenshot shows how the Zipkin tool visualizes a complex API request from the phantom token flow and renders details for all child HTTP requests.
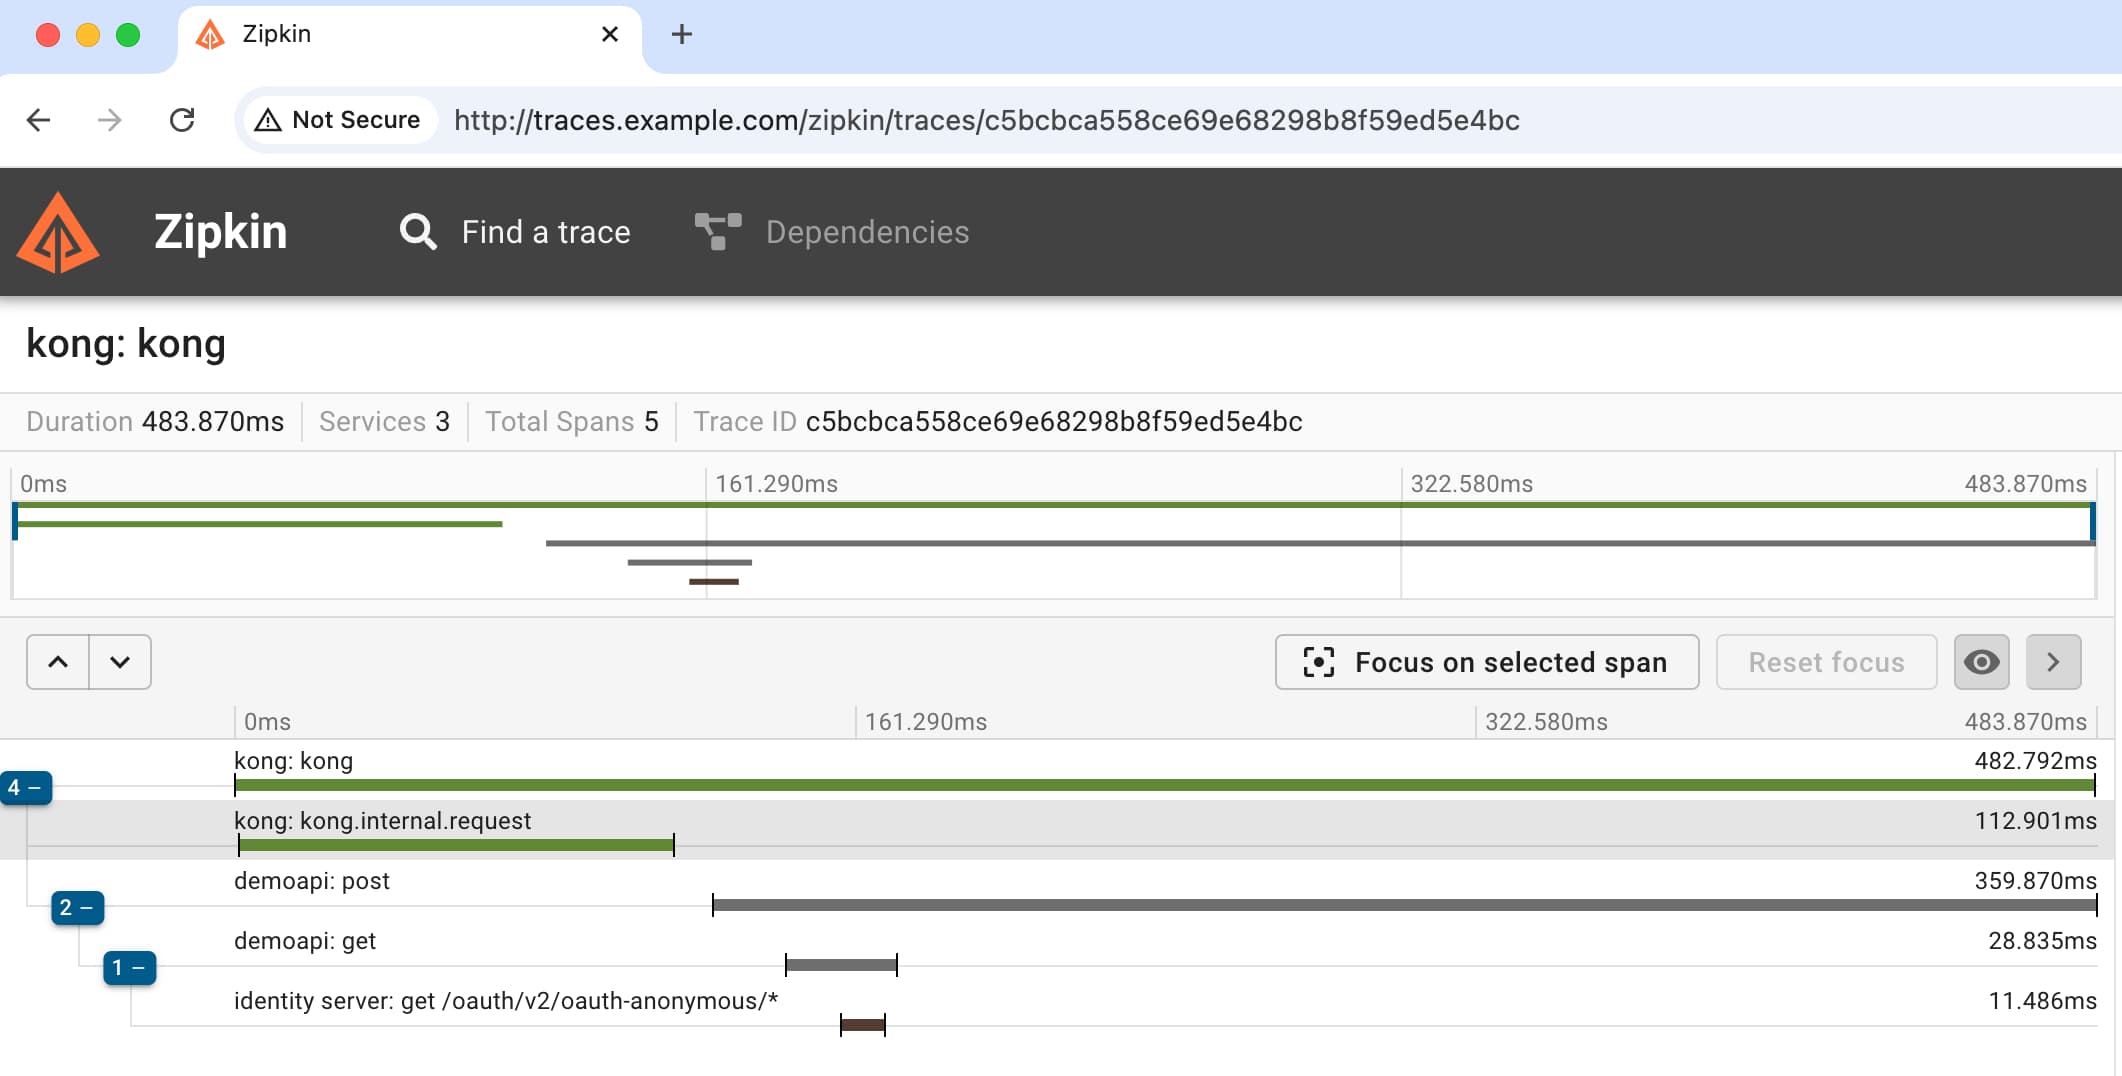
The end result is improved troubleshooting capabilities. In the event of errors or slow requests, the trace data and its links to more detailed technical logs, can help to diagnose issues in a timely manner.
Conclusion
OpenTelemetry tracing improves observability for complex HTTP requests that consist of a number of related units of work. It is therefore a good fit for OAuth environments. The Curity Identity Server supports the essential OpenTelemetry tracing behaviors as part of its modern troubleshooting capabilities.

Join our Newsletter
Get the latest on identity management, API Security and authentication straight to your inbox.

Start Free Trial
Try the Curity Identity Server for Free. Get up and running in 10 minutes.
Start Free TrialWas this helpful?