
Logging and Monitoring Overview
On this page
An authorization server is a critical component that runs within a distributed architecture. The authorization server should provide teams with modern logging and monitoring capabilities to enable fast or automatic resolution of technical issues. You should not need to depend on the authorization server provider's technical support team.
This tutorial provides a summary of how the Curity Identity Server gives your teams control over logging and monitoring behaviors. The Curity Identity Server uses standard design patterns to integrate with platforms and subsystems. When required, the extensibility features of the Curity Identity Server enable custom integrations.
Big Picture
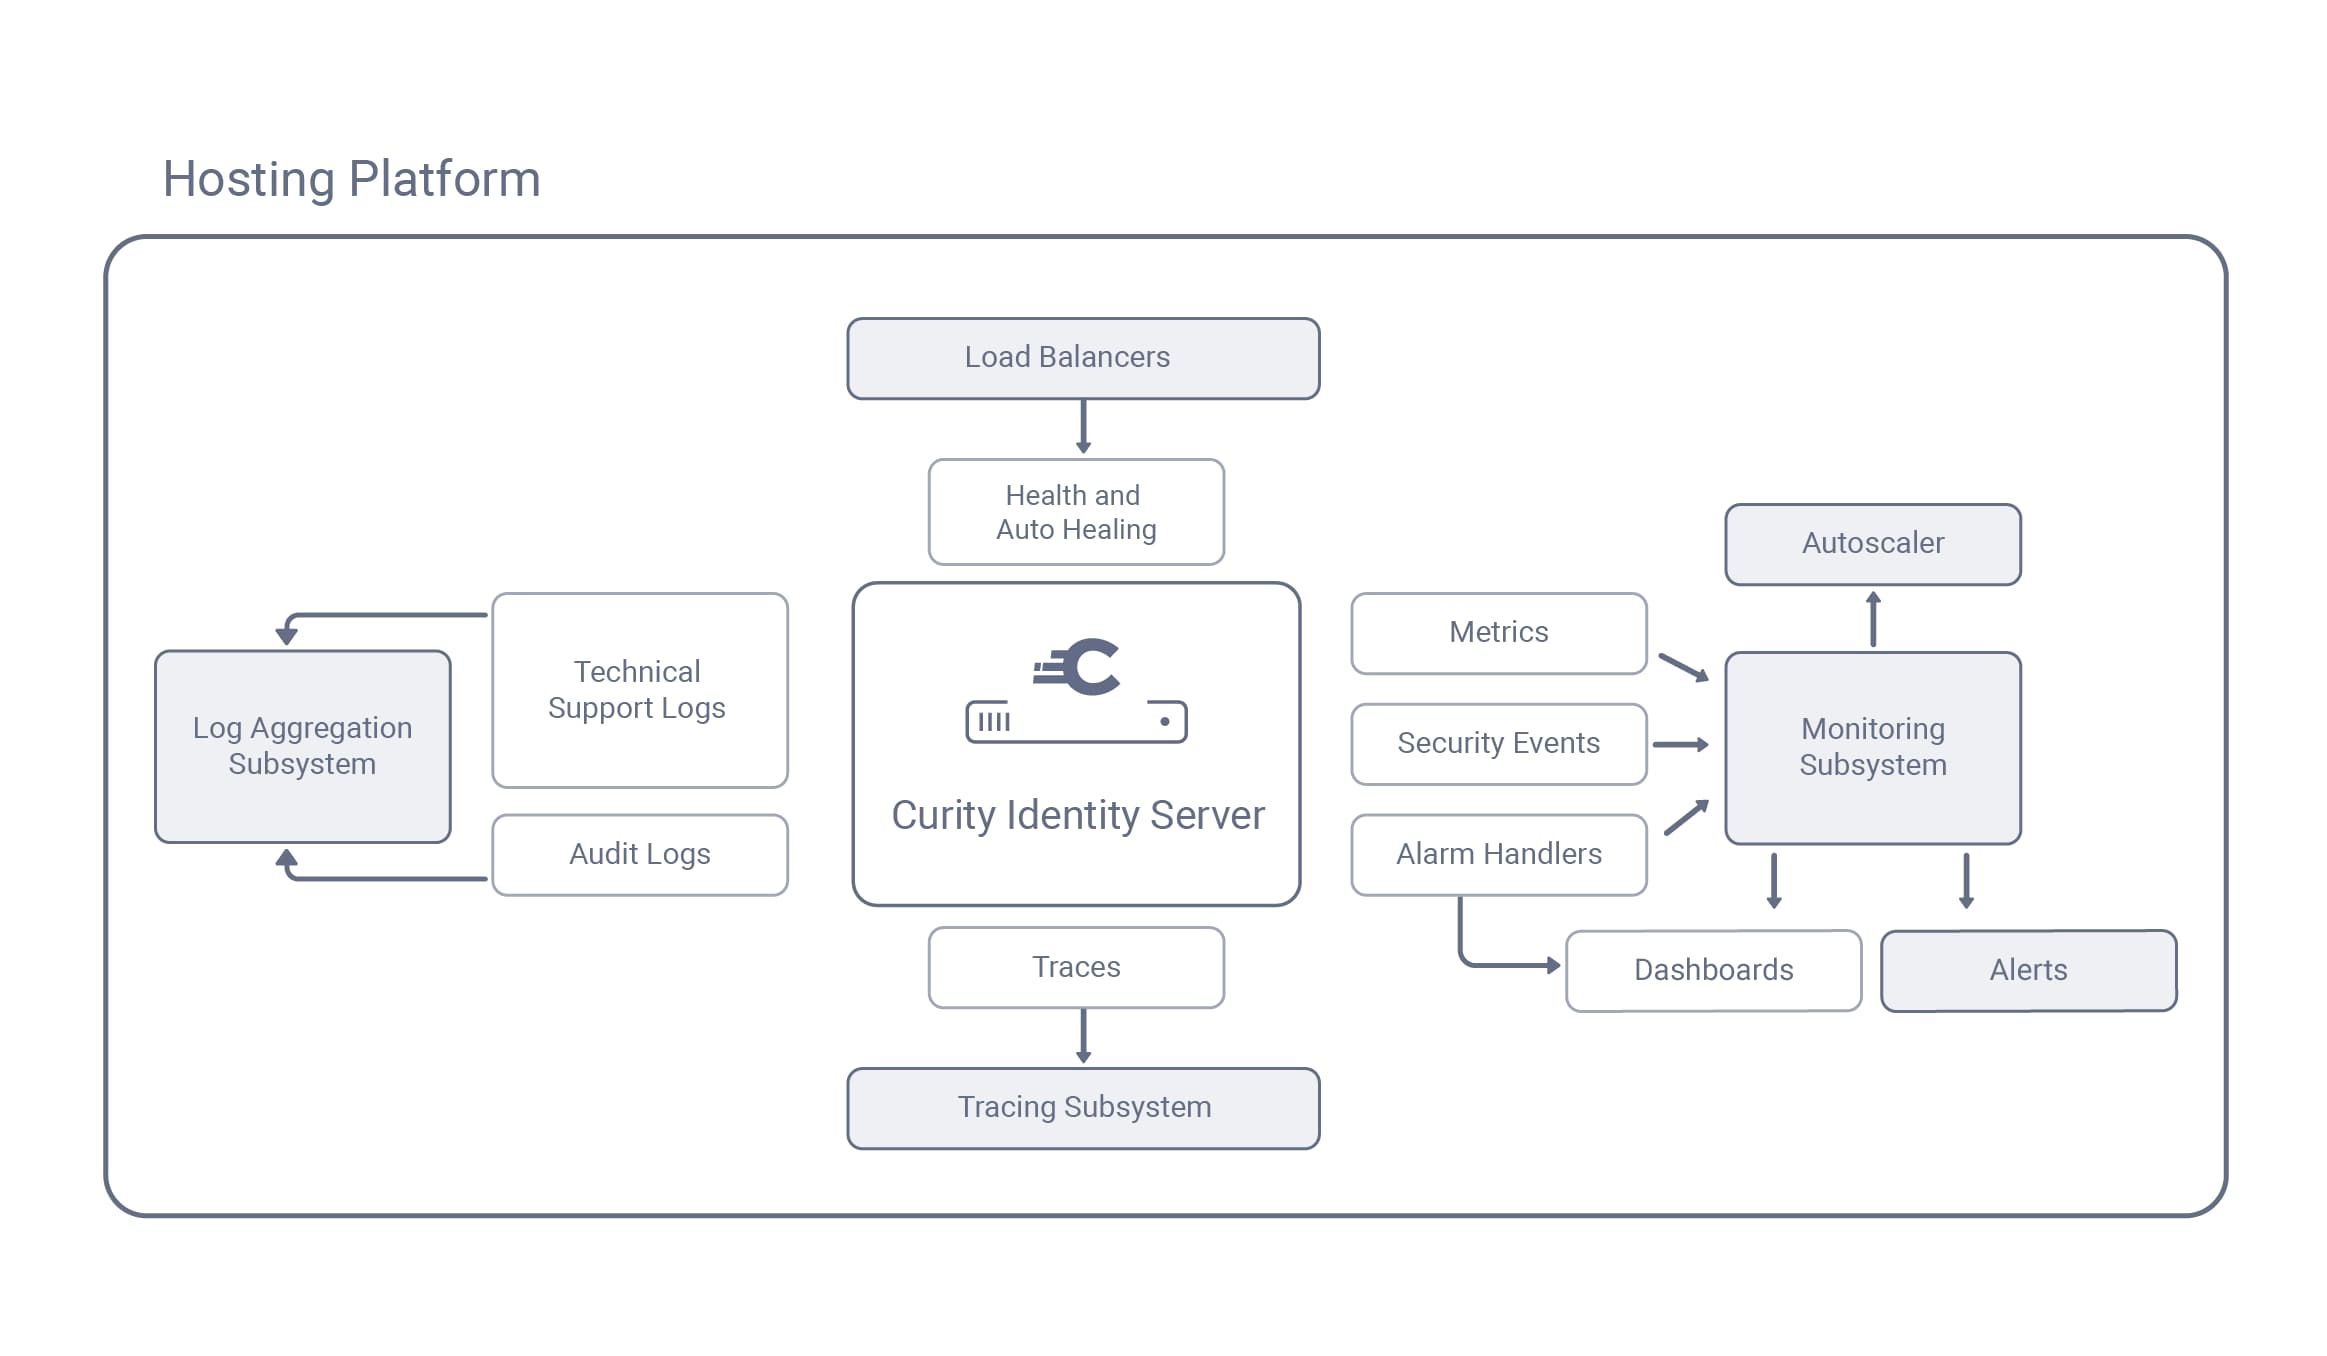
The Curity Identity Server runs in backend hosting platforms alongside other components like APIs and API gateways. Typically, the platform provides services like load balancing and uses subsystems to keep all components healthy. When there are technical issues you use the subsystems for auto healing or for diagnosis.
Health and Auto Healing
Each instance of the Curity Identity Server provides a status endpoint that reports its health. High availability solutions like load balancers can frequently call status endpoints to identify unhealthy instances and mark them down, so that OAuth requests route only to healthy instances. Hosting platforms can maintain the desired number of instances by automatically spinning up a new instance to replace the unhealthy one. Read more in the Health and Auto Healing tutorial.
Alarm Handlers
In some cases the Curity Identity Server may be healthy but a dependency like a data source or a connection to an external identity provider (IDP) fails. Creating new instances of the Curity Identity Server would not solve the problem. Instead, the Curity Identity Server raises alarms and makes them visible in administration user interfaces. You can use a Custom Alarm Handler to implement custom actions in response to alarm events.
Metrics and Alerts
The Curity Identity Server provides an endpoint that publishes a number of custom Prometheus Compliant Metrics. Often the platform itself provides generic CPU and memory metrics. The custom metrics provide information from within the Curity Identity Server's Java process. They include include error counts and information about logins and tokens issued. Monitoring systems can store the metrics as a time series, and you can create rules in the monitoring system to raise occasional people alerts when particular metrics reach a specified threshold.
Dashboards
Curity provides a Grafana Dashboard that you can quickly import to get a visual overview of the most important metrics. If alarms occur you quickly view details in the DevOps Dashboard and the Admin UI.
Auto Scaling
When the Curity Identity Server is under load you can use metrics to automatically increase the number of instances. The Kubernetes Autoscaling tutorial provides a worked example that uses Prometheus and the platform's horizontal autoscaling capability to spin up new instances when the average OAuth request time exceeds a threshold.
Traces
OAuth requests can originate from clients or backend components like APIs. Each request can contact multiple components. To visualize the end-to-end routing of requests use OpenTelemetry Tracing. The Curity Identity Server adds a span to the overall trace for every OAuth request. You can use OpenTelemetry tools to look up a TraceId and visualize its child units of work. In the event of slowness or failures, the OpenTelemetry tools enable fast identification of the failing component.
Technical Support Logs
The Curity Identity Server uses the log4j2 framework, where loggers enable the output of various types of data. To resolve problems, look in the system logs for the cause. You can also use request logs to understand every HTTP request that the Curity Identity Server receives. To enable fast log lookup from a TraceId, configure logs to output the OpenTelemetry TraceId and SpanId fields.
Use appenders to output logs to various locations like stdout, files or databases. To control log formats use layouts. Read more about the techniques in Logging Best Practices. To implement log aggregation you can use a JSON layout that preserves the type of each logged field. Then use a frontend tool to analyze the aggregated logs. The Log Aggregation to Elasticsearch tutorial provides an example deployment that shows how to analyze logs in real time.
Audit Logs and Security Events
The Curity Identity Server provides audit logs about security events, like failed or successful logins. Use the logging framework to customize the output of audit logs and save audit data to a log aggregation system or a database. If required you can implement an Event Listener in Java or Kotlin and process security events in custom ways, for example to integrate with cloud platforms.
Conclusion
OAuth is a distributed architecture so components should use modern logging and monitoring design patterns. The Curity Identity Server separates concerns and uses multiple logging and monitoring techniques, to integrate with platforms and subsystems. Teams can therefore integrate the Curity Identity Server with their preferred observability tools to enable the best troubleshooting and analysis.

Join our Newsletter
Get the latest on identity management, API Security and authentication straight to your inbox.

Start Free Trial
Try the Curity Identity Server for Free. Get up and running in 10 minutes.
Start Free TrialWas this helpful?