
On this page
This tutorial explains how to aggregate various types of logs from the Curity Identity Server and save them as structured JSON documents in the open source Elasticsearch system. The Kibana tool then enables real-time visualization and analysis of logs. The tutorial ends with a deployment example for a Kubernetes cluster that demonstrates end-to-end log aggregation.
There are various ways to deploy Elastic Stack components. This tutorial explains log aggregation logic using the following components.
- Elasticsearch is the data storage engine, which ingests logs at its API endpoints.
- Kibana is a frontend where authorized users can query and analyze log data.
- Filebeat is a log shipping component that uploads logging events to the Elasticsearch API.
The following sections explain how to aggregate system, request and audit logs from the Curity Identity Server to Elasticsearch indices. The log aggregation flow is customizable in various ways.
Prepare Curity Identity Server Logs
Before deploying the Curity Identity Server, ensure that suitable log files are available for aggregation:
- Configure logs for the Curity Identity Server to use a JSON Log Format.
- Configure the Helm chart to Tail Log Files so that all logs are available for shipping.
- Configure the Curity Identity Server to Use OpenTelemetry if you want to include trace IDs and span IDs in logs.
The following example logging events shows some source logs formats for system, request and audit logs.
The system log's message field can include a text message or key value pairs. The following logging event resulted from intentional misconfiguration of a data source connection. Exception events can lead to multiple logging events. Some may have a stack trace and others may contain key value pairs with additional details.
{"timeMillis": 1741275691,"thread": "req-189","level": "WARN","loggerName": "se.curity.identityserver.errors.SystemRuntimeException","message": "se.curity.identityserver.errors.SystemRuntimeException@8b67fc[_httpStatus=500,_errorMessageId=system.status.internal.error,_errorCode=generic_error,_errorDescription=FATAL: database \"idsvr2\" does not exist]","endOfBatch": true,"loggerFqcn": "org.apache.logging.slf4j.Log4jLogger","contextMap": {"LongSessionId": "84aeadea-01cb-4431-bd55-282196a98202","RequestId": "kCPDgMRP","SessionId": "84aeadea","SpanId": "ca8578c5279899bb","TraceId": "2dddaab2003090620ad72cc856b93b9b"},"threadId": 42,"threadPriority": 5,"hostname": "curity-idsvr-runtime-6ccbf9799f-rgrrk"}
Create an Index Template
Elasticsearch log storage uses indices that store documents. Each document contains fields with data types. Filter conditions and sort expressions can use some data types, like keywords, numbers and dates. To help ensure that data saves with the correct types, define an index template with your preferred JSON document structure.
The following example provides an index template creation command to run in Kibana Dev Tools. When Elasticsearch first receives a logging event, it creates an index that uses data types from the template. If a field is not found in the template, Elasticsearch still saves it but in some cases may use a suboptimal data type.
POST /_index_template/curity{"index_patterns": ["curity-*"],"template":{"mappings":{"properties":{"eventTime": {"type": "date"},"hostname": {"type": "keyword"},"level": {"type": "keyword"},"loggerName": {"type": "keyword"},"loggerFqcn": {"type": "keyword"},"message": {"type": "keyword"},"thread": {"type": "keyword"},"threadId": {"type": "integer"},"threadPriority": {"type": "integer"},"thrown": {"type": "object","enabled": false},"contextMap":{"properties":{"RequestId":{"type": "keyword"},"SessionId":{"type": "keyword"},"LongSessionId":{"type": "keyword"},"TraceId":{"type": "keyword"},"SpanId":{"type": "keyword"}}},"system": {"properties":{}},"request": {"properties":{}}"audit": {"properties":{}}}}}}
Each logger can include its own particular fields that add to the base fields. Therefore, you could replace the system, request and audit placeholders in the index template with the following definitions for extra fields.
"system":{"properties":{"type":{"type": "keyword"},"httpStatus":{"type": "integer"},"errorMessageId":{"type": "keyword"},"errorCode":{"type": "keyword"},"errorDescription":{"type": "keyword"}}}
Create an Ingest Pipeline
When you first receive log events, let Elasticsearch save them and apply its own defaults. Typically though, logging components may add extra fields that are not useful, you may receive some empty events, or some fields may have incorrect data types.
To resolve these types of issues, do some extra work to create an Ingest Pipeline that runs one or more Processors. Run the following command in Kibana Dev Tools to create an example ingest pipeline:
PUT /_ingest/pipeline/curity{"description": "Curity Logs Ingest Pipeline","processors": [{"drop": {"if" : "ctx.level == null"},"script": {"lang": "painless","description": "Transform the eventTime to a date","source": "ctx['eventTime'] = Instant.ofEpochMilli(ctx['timeMillis'])"},"remove": {"field": ["log", "marker", "stream", "fields"],"ignore_missing": true}}]}
This example ingest pipeline performs the following tasks:
- The
dropprocessor removed malformed logging events that do not contain the expected fieldlevel. - The
scriptprocessor translates log4j2's timeMillis epoch time to a date type for use in time-based queries. - The
removeprocessor clears log fields that should not save, such as those that Filebeat adds.
For more powerful transformations, write scripts in the Painless Scripting Language to customize the content or structure of the Elasticsearch data.
The following example script processes the key value pairs specific to a system logging event to save error fields in a structured format:
def fields = ctx['fields'];if (fields != null) {String logtype = fields['logtype'];if (logtype == 'system') {String message = ctx['message'];Map system = [:];int start = message.indexOf('[');int end = message.indexOf(']');if (start >= 0 && end >= 0 && end > start) {String type = message.substring(0, start);if (type.length() >= 1) {system['type'] = type;}String messageFieldText = message.substring(start + 1, end);String[] fieldPairs = messageFieldText.splitOnToken(',');if (fieldPairs.length > 0) {for (int i = 0; i < fieldPairs.length; i++) {String[] parts = fieldPairs[i].splitOnToken('=');if (parts.length == 2) {String key = parts[0];String value = parts[1];if (key.substring(0, 1) == '_') {key = key.substring(1, key.length());}if (key == 'httpStatus') {system[key] = Integer.parseInt(value);} else {system[key] = value;}}}ctx['system'] = system;ctx.remove('message');}}}}
Prepare the Log Shipper
Create the index template and ingestion pipeline in Elasticsearch before log shipping begins. Then configure the Filebeat component to read logs from Kubernetes nodes. For each type of log file, use file patterns to set a logtype that Filebeat sends to Elasticsearch in each logging event.
filebeat.inputs:- type: containerpaths:- /var/log/containers/curity-idsvr-runtime*runtime*.log- /var/log/containers/tokenhandler-runtime*-runtime*.logjson:keys_under_root: trueadd_error_key: falsefields:logtype: 'system'- type: containerpaths:- /var/log/containers/curity-idsvr-runtime*request*.log- /var/log/containers/tokenhandler-runtime*request*.logjson:keys_under_root: trueadd_error_key: falsefields:logtype: 'request'- type: containerpaths:- /var/log/containers/curity-idsvr-runtime*audit*.logjson:keys_under_root: trueadd_error_key: falsefields:logtype: 'audit'output.elasticsearch:hosts: ['${ELASTICSEARCH_HOST:elasticsearch}:${ELASTICSEARCH_PORT:9200}']username: ${ELASTICSEARCH_USERNAME}password: ${ELASTICSEARCH_PASSWORD}index: "curity-%{[fields.logtype]}-%{+yyyy.MM.dd}"pipelines:- pipeline: curitysetup:ilm:enabled: falsetemplate:name: "curity"pattern: "curity-*"enabled: false
The output.elasticsearch section references the ingest pipeline and its index uses the logtype to save each type of log data to the correct index. In this example, the name of each index has the following format, where each index contains a single day's log data so that it is straightforward to remove old logs after a time period.
curity-system-20250305curity-request-20250305curity-audit-20250305
The following example structured logs show one possible format for clean and type-safe log data after ingestion.
{"eventTime": "2025-03-06T15:41:31.000Z","loggerFqcn": "org.apache.logging.slf4j.Log4jLogger","level": "WARN","endOfBatch": true,"thread": "req-189","threadPriority": 5,"threadId": 42,"hostname": "curity-idsvr-runtime-6ccbf9799f-rgrrk","system": {"errorCode": "generic_error","errorMessageId": "system.status.internal.error","errorDescription": "FATAL: database idsvr2 does not exist","type": "se.curity.identityserver.errors.SystemRuntimeException@8b67fc","httpStatus": 500},"contextMap": {"LongSessionId": "84aeadea-01cb-4431-bd55-282196a98202","RequestId": "kCPDgMRP","SessionId": "84aeadea","SpanId": "ca8578c5279899bb","TraceId": "2dddaab2003090620ad72cc856b93b9b"}}
Use Kibana to Analyze Logs
Use Kibana Role Management to assign groups of users permissions to indices. For example, you might grant engineers access to system and request logs and compliance teams access to audit logs. Those users can then visualize logs in in Kibana. For example, create Data Views with the following patterns:
- curity-system-*
- curity-request-*
- curity-audit-*
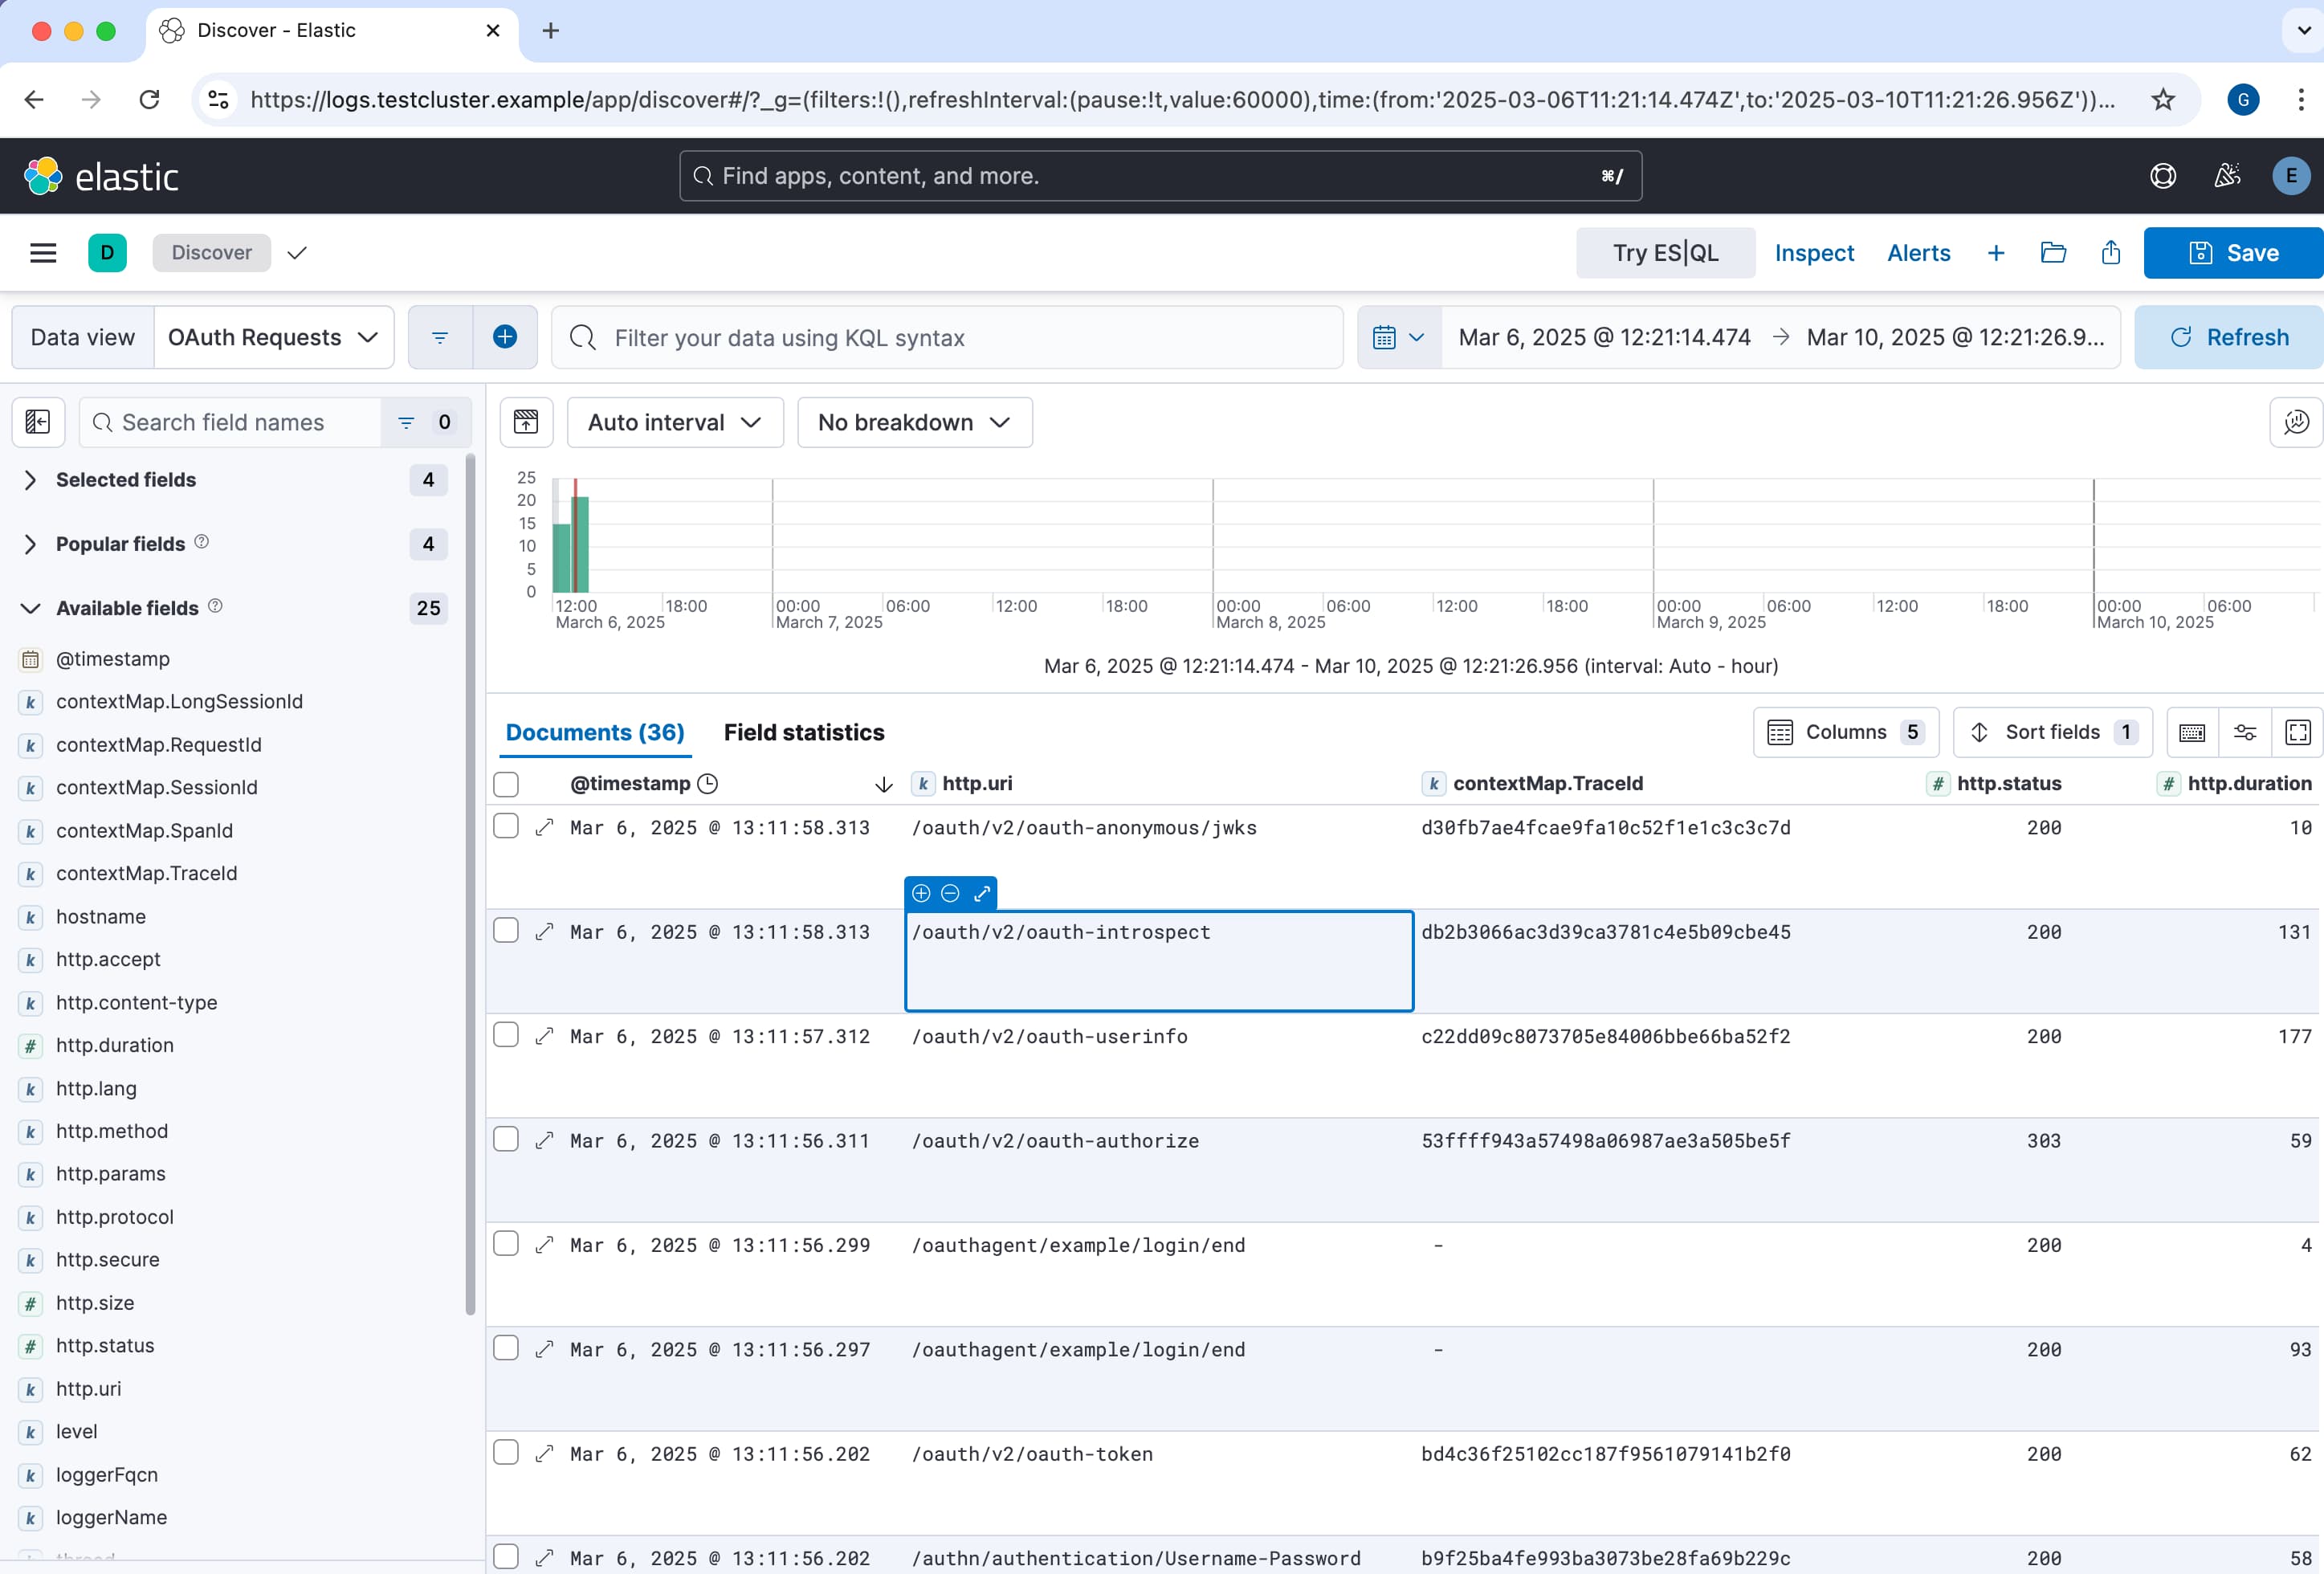
Then use the Discover feature to quickly sort and filter logs or display them in dashboards.
Kibana Dev Tools also provides powerful ways to query and partition log data. The following Lucene Query returns data from the system, request and audit logs that match a particular OpenTelemetry trace ID:
GET curity-*/_search{"query":{"match":{"contextMap.TraceId": "2dddaab2003090620ad72cc856b93b9b"}}}
The following example returns up to 100 JSON documents from system logs that contain a particular error code:
GET curity-system*/_search{"query":{"match":{"system.errorCode": "external_service_error"}},"sort": [{"eventTime": "desc"}],"size": 100}
Alternatively, use SQL Queries to perform operations like selecting particular fields or grouping results. The following example SQL query returns the 10 slowest OAuth requests for a particular time period:
POST _sql?format=txt{"query": """SELECT TOP 10request.uri,request.durationFROM"curity-request*"WHEREeventTime between '2025-03-05' and '2025-03-07'ORDER BYrequest.duration DESC"""}
Example Deployment
The GitHub link at the top of this page provides a worked example deployment of Elastic Stack components to a Kubernetes cluster. Study the deployment and adapt it to your own requirements. The example runs on a local computer, where you could run an end-to-end flow with the following resources:
- Run the Curity Identity Server base Kubernetes deployment.
- Run the Curity Token Handler base Kubernetes deployment to deploy a working web application.
- Run the Elastic Stack deployment and use the web application to generate logs.
- Use Kibana to visualize and query log data.
Conclusion
The Curity Identity Server provides detailed logs as part of its observability and reliability design. To enable real-time troubleshooting and analysis, follow Logging Best Practices to ship logs to a log aggregation system. For best results, do some extra work to transform logs and ensure that all log fields have the correct data types. Teams can then use logs to their full potential when they need to troubleshoot or analyze OAuth related behaviors.

Join our Newsletter
Get the latest on identity management, API Security and authentication straight to your inbox.

Start Free Trial
Try the Curity Identity Server for Free. Get up and running in 10 minutes.
Start Free TrialWas this helpful?