Attaching a Remote Debugger
On this page
In the process of developing plugins for the Curity Identity Server it might be useful to be able to debug the code and with that attach a remote debugger. This article outlines how to configure some of the more common Integrated Development Environments (IDEs) for remote debugging.
The Curity Identity Server
The Curity Identity Server needs to be started with the remote debugging configuration set in JAVA_OPTS. The easiest way to achieve this is to add the JAVA_OPTS command to the startup command:
JAVA_OPTS=-agentlib:jdwp=transport=dt_socket,server=y,suspend=n,address=5005 ./idsvr
However it would also be possible to set JAVA_OPTS more permanently with:
export JAVA_OPTS="$JAVA_OPTS -agentlib:jdwp=transport=dt_socket,server=y,suspend=n,address=5005"
Then start the Curity Identity Server by running idsvr/bin/./idsvr
Running in Docker
When running the Curity Identity Server in Docker there are two preferred options.
- Create a new image based on the official Curity Identity Server image with
JAVA_OPTSset. Then run the container as usual.
FROM curity/idsvr:latestENV JAVA_OPTS="-agentlib:jdwp=transport=dt_socket,server=y,suspend=n,address=*:5005"
- Pass
JAVA_OPTSas an environment variable in the docker run command:
docker run -it -e PASSWORD=Pa55w0rd! -e JAVA_OPTS='-agentlib:jdwp=transport=dt_socket,server=y,suspend=n,address=*:5005' -p 5005:5005 -p 6749:6749 -p 8443:8443 curity.azurecr.io/curity/idsvr
Configure the IDE
Different IDEs will have different ways of configuring a remote debugger for a Java application. In all examples below the Curity Identity Server is assumed to be running on localhost.
From the Run menu, choose Edit Configurations → Add new... → Remote JVM Debug.
Give it a name, idsvr for example. Set the Host to localhost and the port to 5005 and click OK.
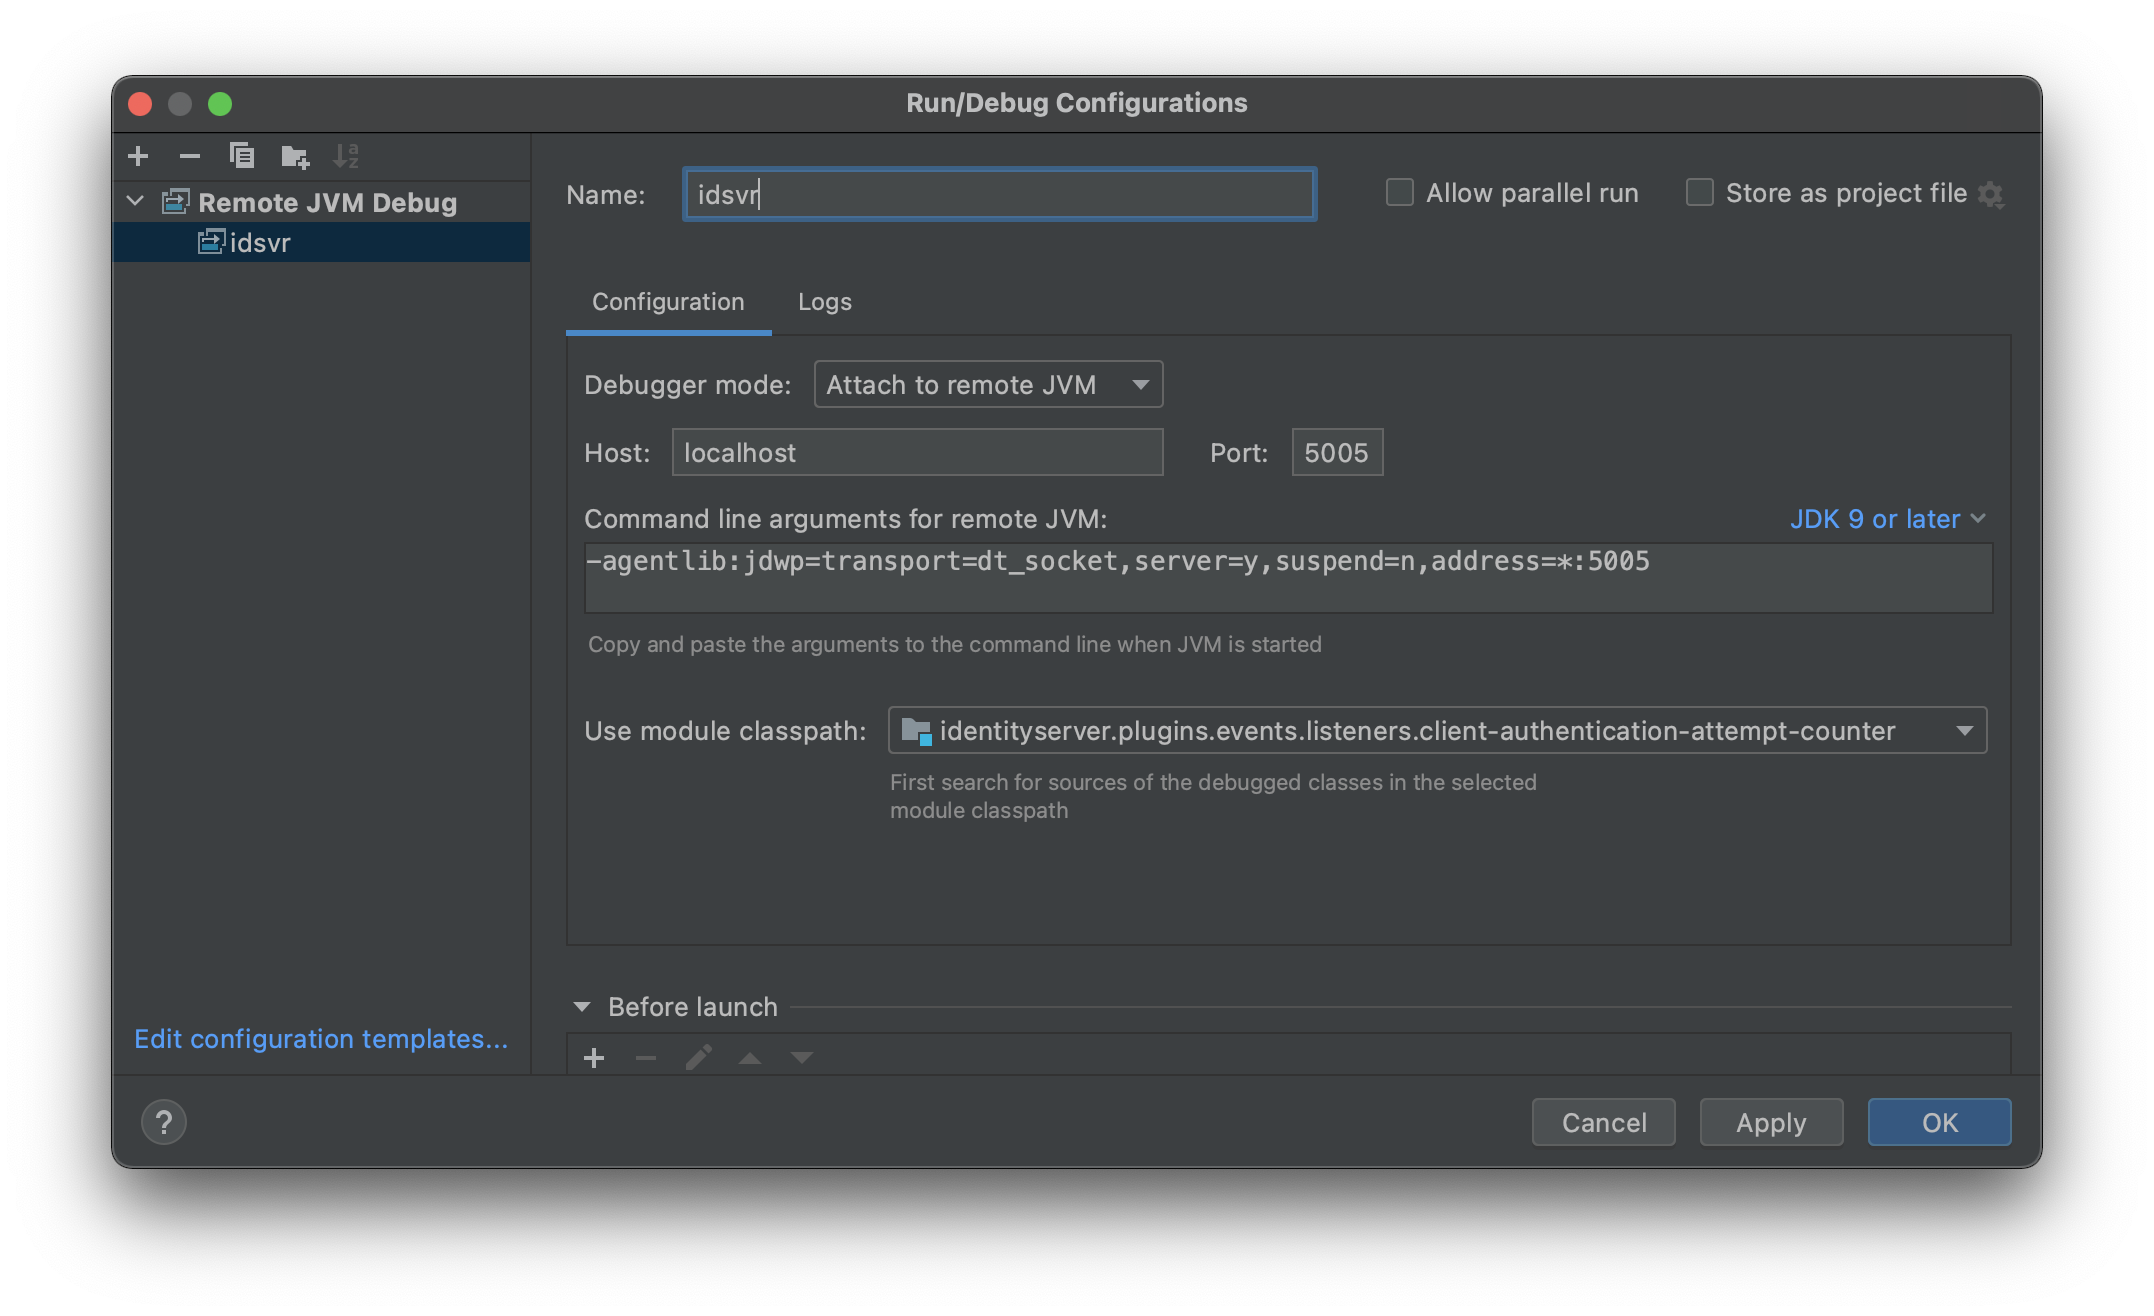 When the Remote Debugger is created, run
 Debug and there will be an option to select what Remote Debugger to use, select idsvr.
Go to View -> Run to open the Run view. Click the ⚙️ to open launch.json.

Add the following to the configurations array:
{"type": "java","name": "Debug (attach)","request": "attach","hostName": "localhost","port": 5005}
After this configuration is saved there should be an option available in the Run and Debug drop-down menu named Debug (attach). Choose that option and click the green play button (or F5) to start debugging.
More details on installing the necessary plugins for Visual Studio Code are outlined in this Using VS Code to Debug Java Applications blog post.
Go to Run → Debug Configurations... → Choose Remote Java Application and click the New Configuration button.
Make sure the Connection Type is set to Standard (Socket Attach). Set the host to localhost and the port to 5005. Then click Debug to start debugging.

Conclusion
Remote debugging is a very convenient tool to use in the process of developing plugins for the Curity Identity Server. It streamlines the development process and is far more useful than printing log statements.
The example screenshot below shows a break point triggered in IntelliJ with a remote debugger running. The FailedVerificationCredentialManagerEvent triggered and the bottom variables panel shows that the subjectid of the event is alice.
Customer Stories
Learn how organizations run identity and API security at scale.
Read customer storiesWas this helpful?