Monitor the Health of Your Curity Cluster
Collect system statistics and visualize the information, providing your team with a quick overview of the health of your system.

Ready-made integrations with Prometheus and Grafana
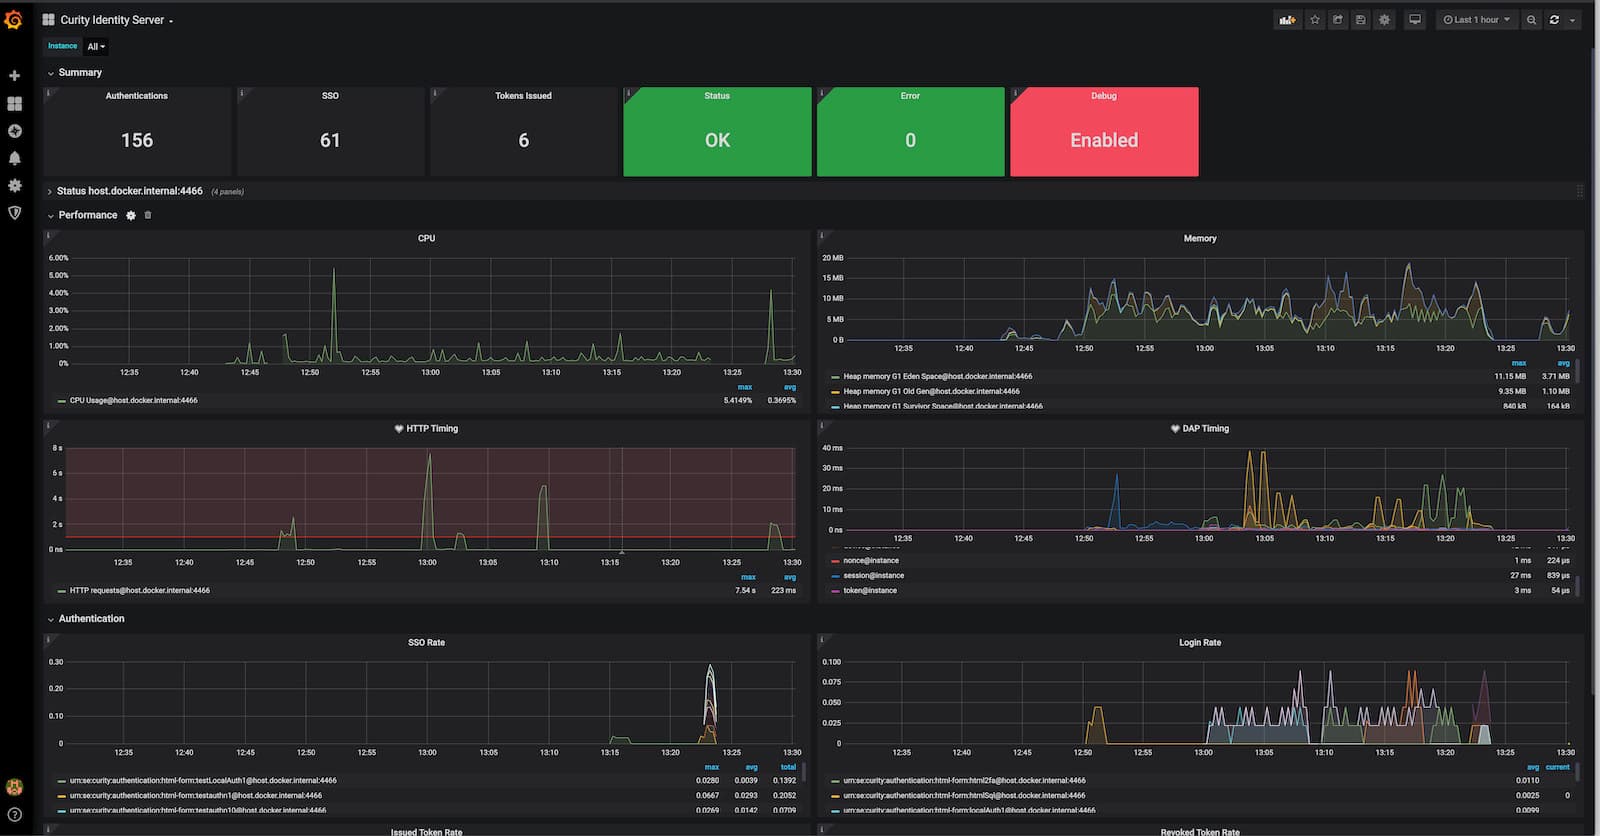
An integration with Prometheus standards metrics allows you to collect system statistics and monitor the health of your Curity Cluster. By adding a Curity Cluster to Prometheus configuration, you can poll for metrics such as CPU or memory usage, issued and revoked tokens, response time for processing HTTP requests or database queries.
Coupled with a Grafana dashboard you can visualize the information, providing your team with a quick overview of the health of your system. You may also use the metrics to configure alerts for thresholds enabling you to react proactively before an issue becomes a problem.

How to Monitor the Curity Identity Server with Grafana
When it comes to your IAM system, you can't afford not to know what's going on behind the scenes. So you need to monitor your system's health and status to detect, predict and mitigate problems before they become outages. This tutorial teaches you how to read and use the Grafana Dashboard for the Curity Identity Server.
Read Article
See Curity Identity Server in action
In this demo, we give you a comprehensive overview of the Curity Identity Server. What it is and what problems it helps you solve.
Watch Demo